

By L.B. Klyashtorin and A.A. Lyubushin (2003 paper in Energy & Environment)
Analysis of the long-term dynamics of World Fuel Consumption (WFC) and the Global Temperature anomaly (dT) for the last 140 years (1961-2000) shows that unlike the monotonously and exponentially increasing WFC, the dynamics of global dT against the background of a linear, age-long trend, undergo quasi-cyclic fluctuations with about 60 a year period. No true linear correlation has taken place between the dT and WFC dynamics in the last century.
Spectral analysis of reconstructed temperature for the last 1420 years and instrumentally measured for the last 140 years global dT shows that dominant
period for its variations for the last 1000 years lies in the 50-60 years interval. Modeling of roughly 60-years cyclic dT changes suggest that the observed rise of dT will flatten in the next 5-10 years, and that we might expect a lowering of dT by nearly 1-0.15C to the end of the 2020s.
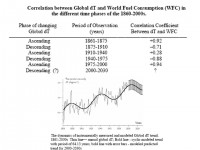
Between 1861-1875, both WFC and dT exhibited simultaneous, well-correlated growth. During 1875-1910, the dynamics of these indices were different. WFC
continues to grow, while global dT decreases, which reflects in negative correlation between the indices. The next period, from 1910 to 1940, is of particular interest in this context. For these 30 years WFC shows virtually no increase because of the global economic crisis of 1920-30s. However, dT in the same period increased by more than 0.4C. During the subsequent 35-years (1940-1975), WFC increased by a factor of 2.5 (from 3 to 7 billion tons.). For the same period, global dT did not increase, but decreased roughly by 0.12C and negative correlation between the WFC and dT dynamics is characteristic of this time period.
Thus, on the background of monotonous increase in WFC during the last 140 years, global dT dynamics exhibited alternating 25-30-year periods of lowering or raising (with the corresponding alternation of positive or negative correlation between the WFC and dT trends). What changes in the dynamics of WFC and Global dT can we expect in the near future, between 2000-2030? Proceeding from the hypothesis of cyclic dynamics of global dT with a period of 50-60 years, we assume that the current “increasing” phase started in 1975 reached its maximum by 2000, then the gradual decrease in dT will start in the nearest few years and continue up to the 2030s.
See larger image here.
Read full paper here.
Icecap Note: Klyahtorin and Lyubushin were exactly right. See global temperature decline since 2002 even as WFC (CO2) continued to increase.
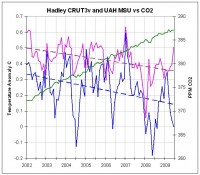
Hadley Monthly Anomalies in rose, UAH MSU in blue, CO2 monthly seasonally adjusted from ESRL. See larger image here.