

By Joseph D’Aleo, CCM
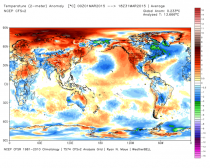
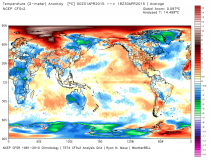
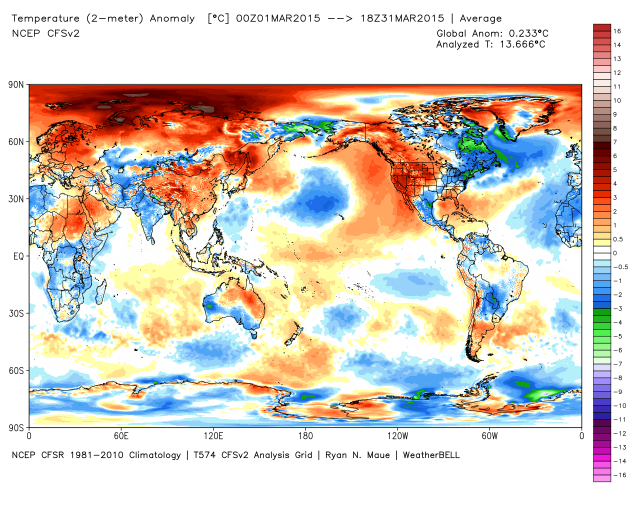
March saw the cold ease in the north central and southeast U.S. as global anomalies fell in the NOAA analysis data (base period of 1981-2010) that goes into the computer models. Despite this global anomaly of just 0.233C, NOAA and NASA announced it was the warmest March in the record back to 1895.
Satellite remote sensing cover the entire globe far better than the land station and ocean data sources and can be trusted to give a more accurate data assessment. On land in the current global data sets, some1200 stations are used. Many are biased warm, especially at night by urban heat island contamination. Also as the GAO found over 41% of the stations did not meet NOAA’s own established minimum requirements for siting and had warm biases,
The situation with the oceans, which cover 71% of the globe, is no better especially with historical data. We currently have a global buoy data set with good coverage since 2004 but before we relied on patchwork data from ships with slowly changing methodology to estimate the global temperatures for the oceans.
To make matters worse, NOAA and NASA have also added adjustments to the data that enhance the apparent warming by cooling the past, perhaps to better match the climate models they run. This allows them and the media to proclaim each month and year was the warmest or among the warmest ever. An investigation in ongoing into how much they have changed the data and what the real data says. We have old data sets and they tell us the adjustments are larger than justified and always in the same direction (more warming). But we will let the experts have their say.
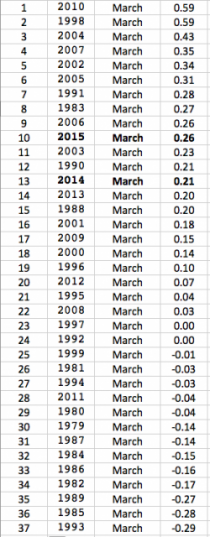
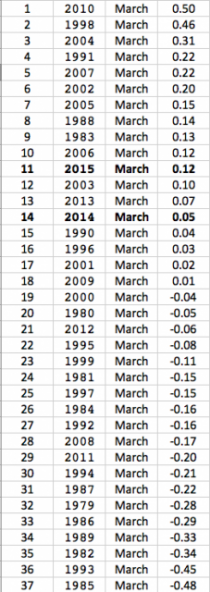
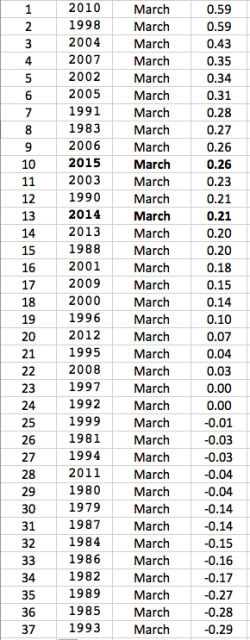
RSS showed this March was 10th warmest in 37 years. 2014 March was 13th warmest.
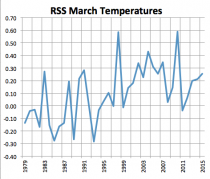
RSS March Global
Enlarged
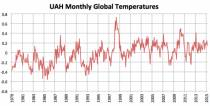
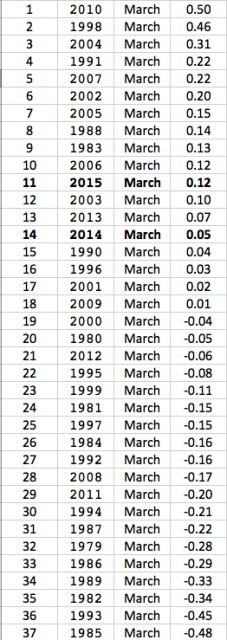
UAH had March as the 11th warmest and 2014 March the 14th warmest.
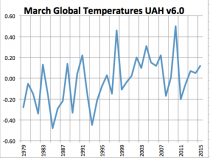
UAH 6.0 March Global
Enlarged
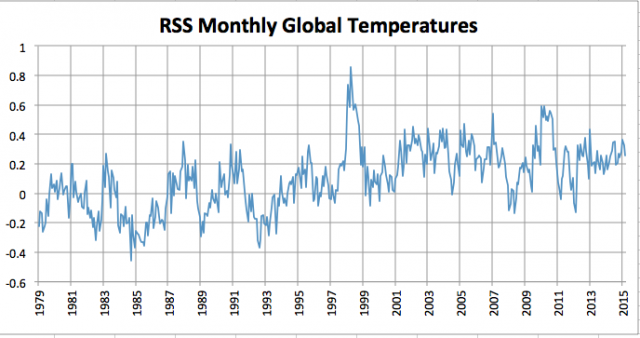
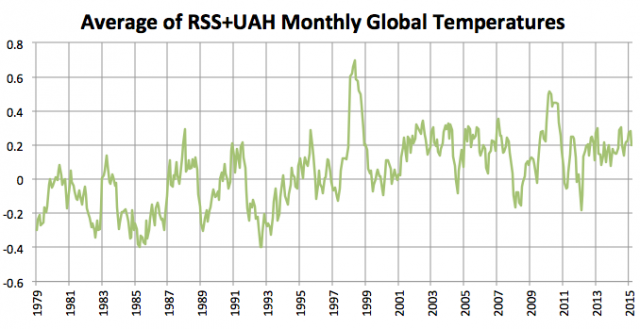
The new UAH data show no warming for 219 months, and for the RSS data, it’s 220 months.
_thumb.png)
Longer term, there is slow erratic rise up to about 1998 but the apparent warming is greater due to the cooling volcanic periods in the early 1980s (El Chichon and Mt. St. Helens) and early 1990s (Pinatubo and Cerro Hudson).


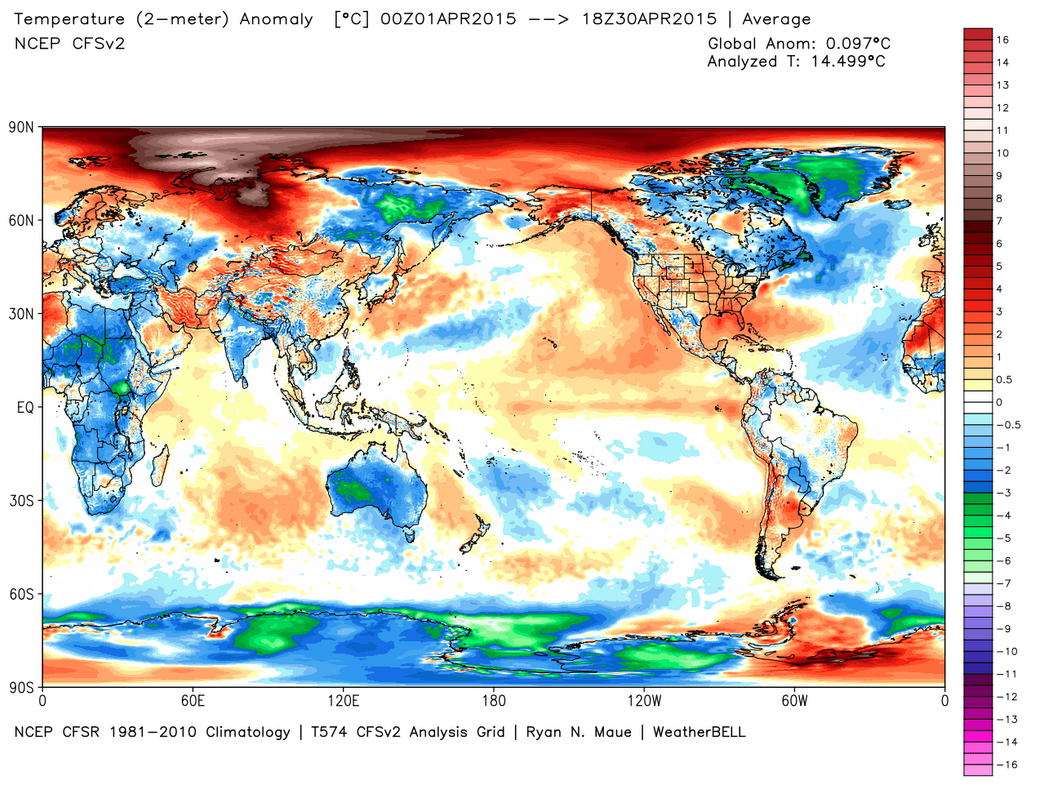
Next will come April where Africa, Australia, India, eastern Europe, the Middle East and western and eastern FSU and much of Antarctica was cold. Observation data compiled for the models show a cooling to just 0.097C above normal. We will see whether NCDC and NASA proclaim it the warmest April.
.png)