

By Tony Bonnici, UK Daily Express
NEW evidence has cast doubt on claims that the world’s ice-caps are melting, it emerged last night. Satellite data shows that concerns over the levels of sea ice may have been premature. It was feared that the polar caps were vanishing because of the effects of global warming. But figures from the respected US National Oceanic and Atmospheric Administration show that almost all the “lost” ice has come back. Ice levels which had shrunk from 13 million sq km in January 2007 to just four million in October, are almost back to their original levels. Figures show that there is nearly a third more ice in Antarctica than is usual for the time of year. The data flies in the face of many current thinkers and will be seized on by climate change sceptics who deny that the world is undergoing global warming.
They add that snow cover across the area is at its greatest since 1966. The one exception is Western Europe, which has - until the weekend when temperatures plunged to as low as -10C in some places - been basking in unseasonably warm weather. The UK has reported one of its warmest winters on record. However, vast swathes of the world have suffered chaos because of some of the heaviest snowfalls in decades. Central and southern China, the USA and Canada were hit hard by snowstorms. Even the Middle East saw snow, with Jerusalem, Damascus, Amman and northern Saudi Arabia reporting the heaviest falls in years and below-zero temperatures. Meanwhile, in Afghanistan snow and freezing weather killed 120 people. In Britain the barmy February weather came to an abrupt halt at the weekend as temperatures plunged to -10C in central England. Experts believe that this month could end up as one of the coldest Februaries in Britain in the past 10 years. Read more here.
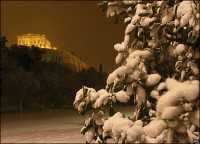
Athens News Agency
A raging snow storm that blanketed most of Greece over the weekend also continued into the early morning hours on Monday, plunging the country into sub-zero temperatures. Public transport buses were at a standstill on Monday in the wider Athens area, while ships remained in ports, public services remained closed, and schools and courthouses in the more severely-stricken prefectures were also closed. Scores of villages, mainly on the island of Crete, and in the prefectures of Evia, Argolida, Arcadia, Lakonia, Viotia, and the Cyclades islands were snowed in.
In Athens, up to 10 to 15 cm was reported (4-6 inches). Attica, Evia, the Cyclades islands and Crete were the most hard hit by the continuing snow storm on Monday, while snow chains were required throughout most of the National Highway network and in most parts of Attica prefecture. Problems were also caused by a blanket of ice that has formed from partially-melted snow beneath the new snowfall.
Icecap Note: Southeasternmost Europe and the Middle East across southern Asia have been hardest hit this winter with the Siberian air directed south and southwest instead of west or east. Northwest and western Europe escaped the worst of the cold much like the eastern United States at least until this month when cold set in. Most meteorologists will tell you there is a high correlation between the anomalies felt in western europe and the eastern United States as they are about a wavelength apart in the normal jet stream wave pattern.
New York Times
The New York Times Warns Fluorescent Bulb ‘Dangers are Real and Growing’. Across the world, consumers are being urged to stop buying outdated incandescent light bulbs and switch to new spiral fluorescent bulbs, which use about 25 percent of the energy and last 10 times longer. In Britain, there is a Ban the Bulb movement. China is encouraging the change. And the United States Congress has set new energy efficiency standards that will make Edison’s magical invention obsolete by the year 2014.
Now, the question is how to dispose of these compact fluorescent bulbs once they break or quit working. Unlike traditional light bulbs, each of these spiral bulbs has a tiny bit of a dangerous toxin - around five milligrams of mercury. And although one dot of mercury might not seem so bad, almost 300 million compact fluorescents were sold in the United States last year. That is already a lot of mercury to throw in the trash, and the amounts will grow ever larger in coming years. Businesses and government recyclers need to start working on more efficient ways to deal with that added mercury. Ellen Silbergeld, a professor of environmental health at Johns Hopkins University in Baltimore, is raising the cry about the moment when millions of these light bulbs start landing in landfills or incinerators all at once. The pig in the waste pipeline, she calls it.
For all that good, the dangers are real and growing. It is time to find more efficient ways of recycling these fluorescents or, better yet, to invent light bulbs that don’t leave a toxic hangover. Read more here.

Tom Nelson Blogspot
1. Uber-alarmist James Hansen is head of NASA Goddard Institute for Space Studies.2. Hansen is said to be the boss of RealClimate alarmist Gavin Schmidt at NASA GISS.3. Gristmill alarmist Andrew Dessler says he did his post-doctoral work at NASA Goddard. 4. RealClimate alarmist Eli Rabbet is said to be Josh Halpern: Prof. Halpern is also the Co-Director of the NASA Faculty Fellowship Program at Goddard Space Flight Center, Greenbelt, MD in odd numbered years. This program supports about 30 faculty each year to do summer research at Goddard. When this worldwide global warming hysteria inevitably dies, it will probably become clear that a core cause was groupthink among a surprisingly small set of people. Comment by Peter Risdon: Hansen’s work was also at the heart of the global cooling scares of the 1970s.
By Nishika Patel, The Standard
As Hong Kong shivers through its second-longest cold spell since 1885, scientists point to global warming to explain the abnormal cold weather phenomenon worldwide. Unusually cold weather is gripping a number of countries, including China and Canada. “We are seeing extremely unusual weather across the world,” said polar researcher Rebecca Lee Lok-sze. “This is due to human activities and our style of living. Carbon dioxide emissions are heavy, which is changing the weather rapidly. We could see colder winters and hotter summers in the future in Hong Kong.”
Greenpeace echoed the view, saying mainland scientists had also concluded that the extreme cold weather in China was triggered by climate change. “This does not only cause an increase in global warming but also causes extreme weather patterns,” said campaigner Edward Chan. Hong Kong has also experienced more than 456 hours of cold weather this winter - more than double the 205-hour record in January 2004. Read more here.
By Anthony Watts, Watts Up with That
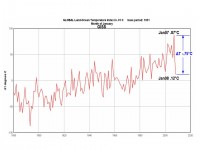
Goddard Institute for Space Studies (GISS) Land-Ocean Global temperature index data was released yesterday for the month of January, 2008. Like we’ve reported before for other datasets, including the RSS and UAH satellite temperature anomalies, GISS also had a sharp drop in January. The GISS change in temperature was -.75C, which is larger than the satellite data from UAH change of -.588C and the RSS RSS change of -.629C.
The change in temperature of -.75C from January 2007 to January 2008 appears to be the largest single year to year January drop for the entire GISS data set. This is yet one more indication of the intensity of planet-wide cooler temperatures seen in January 2008, particularly in the Northern Hemisphere, which has seen record amounts of snow coverage extent as well as new record low surface temperatures in many places. Read full blog here.
See full size image here
By By John Goetz, on Climate Audit
Back in September when I was busy trying to figure out how Hansen combined station data, I was bothered by the fact that he used annual averages as the basis for combining scribal records (via the “bias method") rather than monthly averages, which are readily available in the records that he uses. In my thinking, the use of monthly averages would provide twelve times the number of data points to use for combining records.
Recently, I began wondering just how much estimation is going on. On February 7 I downloaded the raw GHCN data (v2.mean.Z) from the NOAA FTP site to see if I could get a handle on how much estimation Hansen does by examining the frequency of missing monthly data. Hansen does not use every single record from this dataset, but he does use almost all of them. Thus, an analysis of the GHCN data should provide a close approximation of how much estimation Hansen does.
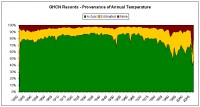
The yellow section represents the percentage of station records with fewer than twelve months of valid data, but enough data for Hansen’s algorithm to calculate an estimated average. The red section represents the percentage of station records missing enough data to preclude even an estimation of the annual average temperature.
To compound the problem, the last thirty years have seen a significant station record die-off. Most are familiar with the graphic on the GISS website showing the number of stations used in Hansen’s analysis. I always found it interesting that this graphic ends with the year 2000, and seems to have a rather precipitous drop in stations during that year. Thus, I decided to count the number of GHCN records on an annual basis, and the results tracked rather well with the GISS graphic. Note that my count is of records, whereas Hansen counts stations. Prior to 1992 multiple records might consolidate to a single station, which explains why my absolute numbers are higher than Hansen’s. This chart shows the number of records on an annual basis since 1880:
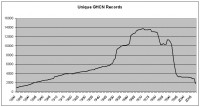
The above graphic shows that, while GISS says 2007 was the hottest year on record and GHCN indicates it had the second highest level of temperature estimation, GHCN also indicates that the number of data points for 2007 were the fewest since before 1900.
To summarize what I am seeing from the GHCN data: (1) the number of stations / records has been dropping dramatically in recent years and (2) with that drop the quality of the record-keeping has also dropped dramatically because we are seeing a corresponding rise in estimated annual temperatures and/or insufficient data to calculate an annual temperature. Using this data, GISS is showing that the temperature anomaly in recent years is the highest recorded in the historical record. Read full assessment here.
Investor’s Business Daily
Not every scientist is part of Al Gore’s mythical “consensus.” Scientists worried about a new ice age seek funding to better observe something bigger than your SUV - the sun. Back in 1991, before Al Gore first shouted that the Earth was in the balance, the Danish Meteorological Institute released a study using data that went back centuries that showed that global temperatures closely tracked solar cycles. To many, those data were convincing. Now, Canadian scientists are seeking additional funding for more and better “eyes” with which to observe our sun, which has a bigger impact on Earth’s climate than all the tailpipes and smokestacks on our planet combined.
And they’re worried about global cooling, not warming. Kenneth Tapping, a solar researcher and project director for Canada’s National Research Council, is among those looking at the sun for evidence of an increase in sunspot activity. Solar activity fluctuates in an 11-year cycle. But so far in this cycle, the sun has been disturbingly quiet. The lack of increased activity could signal the beginning of what is known as a Maunder Minimum, an event which occurs every couple of centuries and can last as long as a century. Such an event occurred in the 17th century. The observation of sunspots showed extraordinarily low levels of magnetism on the sun, with little or no 11-year cycle. This solar hibernation corresponded with a period of bitter cold that began around 1650 and lasted, with intermittent spikes of warming, until 1715. Frigid winters and cold summers during that period led to massive crop failures, famine and death in Northern Europe.
Tapping reports no change in the sun’s magnetic field so far this cycle and warns that if the sun remains quiet for another year or two, it may indicate a repeat of that period of drastic cooling of the Earth, bringing massive snowfall and severe weather to the Northern Hemisphere. Read more here.