


Posted by Paul on Jennifer Marohasy’s The Politics and Environment Blog
Jasper Kirkby of CERN has published a new paper examining the potential link between cosmic rays and climate.
The paper concludes: Numerous palaeoclimatic observations, covering a wide range of time scales, suggest that galactic cosmic ray variability is associated with climate change. The quality and diversity of the observations make it difficult to dismiss them merely as chance associations. But is the GCR flux directly affecting the climate or merely acting as a proxy for variations of the solar irradiance or a spectral component such as UV? The most likely mechanism for a putative GCR-climate forcing is an influence of ionisation on clouds, as suggested by satellite observations and supported by theoretical and modelling studies. The satellite data suggest that decreased GCR flux is associated with decreased low altitude clouds, which are known to exert globally a net radiative cooling effect. Studies of Forbush decreases and solar proton events further suggest that decreased GCR flux may reduce high altitude (polar stratospheric) clouds in the Antarctic.
Despite these uncertainties, the question of whether, and to what extent, the climate is influenced by solar and cosmic ray variability remains central to our understanding of the anthropogenic contribution to present climate change. Real progress on the cosmic ray-climate question will require a physical mechanism to be established, or else ruled out. With new experiments planned or underway, such as the CLOUD facility at CERN, there are good prospects that we will have some firm answers to this question within the next few years. Read more of the blog here.
By Anthony Watts, Watts Up With That
Background for new readers: The US Historical Climatological Network is a hand picked set of 1221 weather stations around the USA used to monitor climate. The network is currently being surveyed by a team of volunteers at www.surfacestations.org.
When I visited The National Climatic Data Center a couple of weeks ago, one of the presentations made to me was on the upcoming implementation of the USHCN2 adjustments to the NOAA surface temperature record. Many have been critical of USHCN1 adjustments and for good reason - it completely misses some documented and undocumented station moves and biases that we have shown to be present via photography from the www.surfacestations.org project.
The goal of USHCN2 appears to be mostly in finding undocumented change points in the data, since from my discussions at NCDC it became clear to me that the metadata they have on hand is not always accurate (or even submitted by NWS personnel to NCDC in some instances). The weak link is the field reporting of metadata. They recognize that. NCDC is thus faced with the task of finding and correcting such change points so that the bias from a site move to a warmer or cooler measurement environment doesn’t show up as a false trend in data.
Station moves are only part of the potential biases that can creep into the surface record of a station. USHCN2 will not catch and correct for things like: (1) Gradual UHI increase in the surrounding area, (2) Tree shading/vegetation growth/loss near the sensor increasing/decreasing gradually, (3) A gradual buildup of surface elements around the sensor, such as buildings, asphalt, concrete etc. (though is an asphalt parking lot suddenly went up close by that would likely show as a step which may be detected) (4) Drift of the temperature sensor +/- over time, (5) Other low frequency changes that don’t show a step function in the data.
When I queried Matt Menne during the presentation at NCDC about the sensitivity of the new algorithm to detect changepoints, he suggested it would have about a 0.5C step threshold. I had hoped it would be more sensitive. Read much more about this critical effort to get the data right here.
By Roger Pielke Sr., Climate Science
There is a very important new weblog on water vapor and cloud feedbacks within the climate system as represented by the models used to project multi-decadal climate change. The paper is Sun, D.-Z., Y. Yu, and T. Zhang, 2007: Tropical Water Vapor and Cloud Feedbacks in Climate Models: A Further Assessment Using Coupled Simulations. J. Climate, Submitted.
Excerpt from the abstract “By comparing the response of clouds and water vapor to ENSO forcing in nature with that in AMIP simulations by some leading climate models, an earlier evaluation of tropical cloud and water vapor feedbacks has revealed two common biases in the models: (1) an underestimate of the strength of the negative cloud albedo feedback and (2) an overestimate of the positive feedback from the greenhouse effect of water vapor. Extending the same analysis to the fully coupled simulations of these models as well as to other IPCC coupled models, we find that these two common biases persist.”
The message from the Sun et al study, therefore, is that the models used to make the multi-decadal global climate projections that are reported in the IPCC report are “...that underestimating the negative feedback from cloud albedo and overestimating the positive feedback from the greenhouse effect of water vapor over the tropical Pacific during ENSO is a prevalent problem of climate models.” This study indicates that the IPCC models are overpredicting global warming in response to positive radiative forcing. Read more here.
Roger Pielke Jr.
The folks at Real Climate have produced a very interesting analysis that provides some useful information for the task of framing a falsification exercise on IPCC predictions of global surface temperature changes. The exercise also provides some insight into how this branch of the climate science community defines the concept of consistency between models and observations, and why it is that every observation seems to be, in their eyes, “consistent with” model predictions. This post explains why Real Climate is wrong in their conclusions on falsification and the why it is that two decades of cooling can be defined as “consistent with” predictions of warming.
Real Climate defines observations to be “consistent with” the models to mean that an observation, with its corresponding uncertainty range, overlaps with the spread of the entire ensemble of model realizations. This is the exact same definition of “consistent with” that I have criticized here on many occasions. Why? Because it means that the greater the uncertainty in modeling—that is, the greater the spread in outcomes across model realizations—the more likely that observations will be “consistent with” the models. More models, more outcomes, greater consistency - but less certainty. It is in this way that pretty much any observation becomes “consistent with” the models.
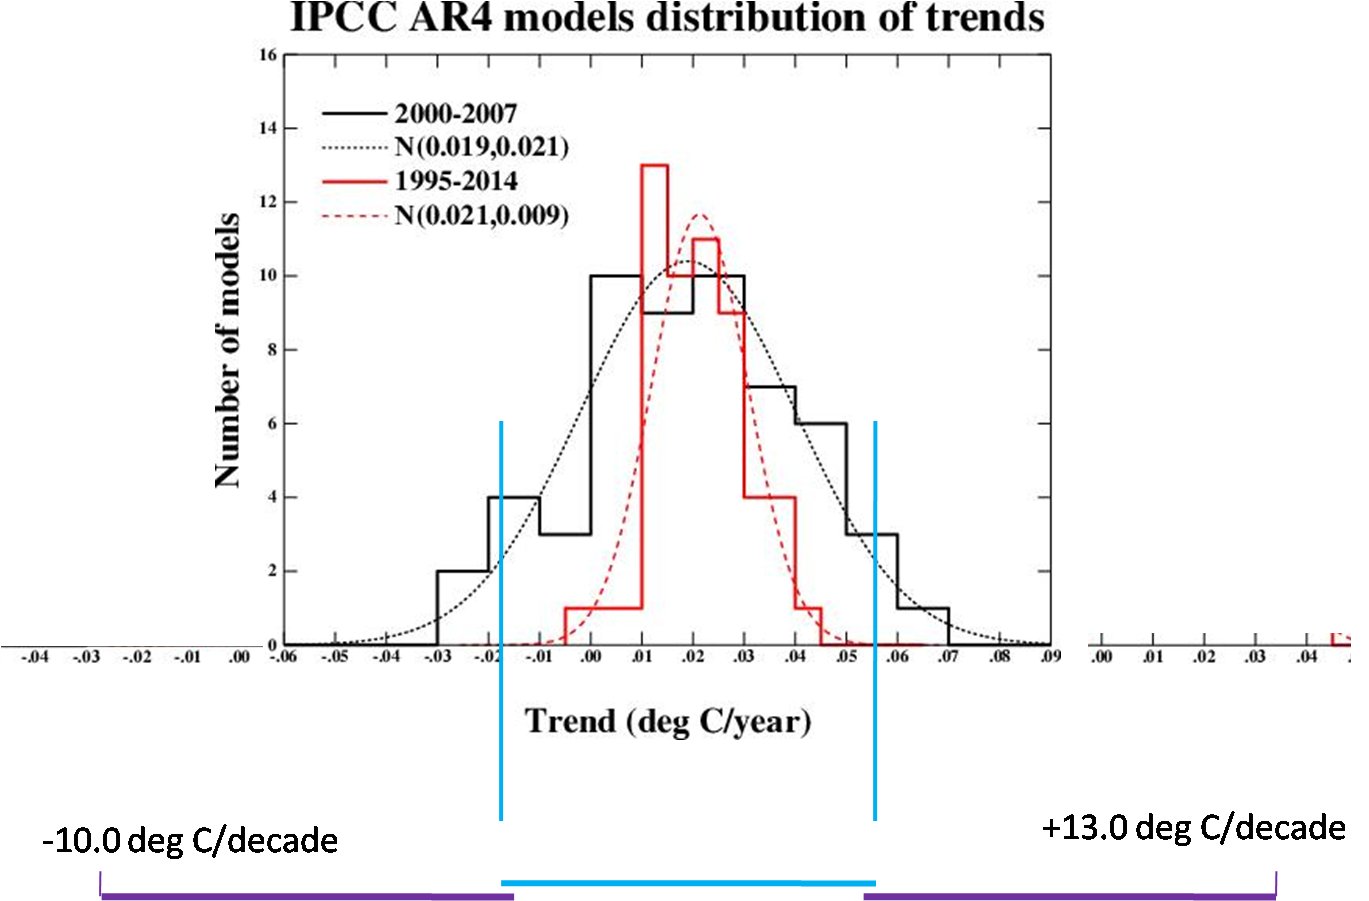
The figure below takes the 95% spread in the observations and illustrates how far above and below the 95% spread in the models some overlap would allow. If the test of “consistent with” is defined as any overlap between models and observations, then any rate of cooling or warming between -10 deg C/decade and +13.0 dec C/decade could be said to be “consistent with” the model predictions of the IPCC. This is clearly so absurd as to be meaningless.
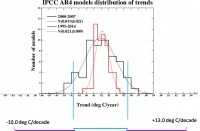
See full size graph here.
Read more here.
By CO2 Science
In a story entitled ”East Siberian Arctic Temperatures of the Last Interglacial” the Idson’s challenge Hansen’s assertion the current warming may be unprecedented. In an attempt to portray earth’s current temperature as being extremely high and, therefore, extremely dangerous (as well as CO2-induced), Hansen et al. (2006) have claimed the earth “is approximately as warm now as at the Holocene maximum and within ~1C of the maximum temperature of the past million years.
In a study that provides evidence that is pertinent to this claim, Kienast et al. studied plant macrofossils found in permafrost deposits on Bol’shoy Lyakhovsky Island (73N, 141 30E) of the New Siberian Archipelago on the coast of the Dimitrii Laptev Strait, from which they reconstructed climatic conditions that prevailed during the prior or Eemian Interglacial.
In the words of the five researchers, “macrofossils of warmth-demanding shrubs and aquatic plants, occurring farther south today, indicate that local mean temperatures of the warmest month were at least 12.5C, thus 10C higher than today at that time,” when maximum atmospheric CO2 levels were on the order of 290 ppm, or about 100 ppm less than they are today.
This finding is just one of many that indicate that various places on the planet have been much warmer than they are today at various times over the past million years, and when the air’s CO2 content was also much lower than it is today. For more such examples, see our Major Report Carbon Dioxide and Global Change: Separating Scientific Fact from Personal Opinion, which also presents evidence refuting many of Hansen’s other outlandish claims.
In another story ”Accelerated Disintegration of the Greenland Ice Sheet” the Idso’s report a phenomenon that both Al Gore and James Hansen promote involves the thousands of meltwater pools or supraglacial lakes that form on the surface of the Greenland Ice Sheet each summer, and the conduits or moulins that can form in fractures beneath them and rapidly drain their water to the bedrock at the bottom of the ice sheet, enhance the ice sheet’s basal lubrication, and thereby cause portions of it to flow faster towards the sea. Two papers published in Sciencexpress on 17 April 2008 bring a much needed dose of reality to the discussion of the role that is likely to be played by this phenomenon in Greenland’s potential contribution to future sea level rise; and their findings are radically different from what Gore and Hansen contend. Read more here.
Tip of the hat to Marc Morano for calling attention to these important new stories.
By Dan Joling, AP
A federal judge has ordered the Interior Department to decide within 16 days whether polar bears should be listed as a threatened species because of global warming. U.S. District Judge Claudia Wilken agreed with conservation groups that the department missed a Jan. 9 deadline for a decision. She rejected a government request for a further delay and ordered it to act by May 15.
The ruling is a victory for conservation groups that claim the Bush administration has delayed a polar bear decision to avoid addressing global warming and to avoid roadblocks to development such as the transfer of offshore petroleum leases in the Chukchi Sea off Alaska’s northwest coast to oil company bidders. “We hope that this decision marks the end of the Bush administration’s delays and denial so that immediate action may be taken to protect polar bears from extinction,” Greenpeace representative Melanie Duchin said in a statement. A decision to list polar bears due to global warming could trigger a recovery plan with consequences beyond Alaska. Opponents fear it would subject new power plants and other development projects to federal review if they generate greenhouse gasses that add to warming in the Arctic. Read more here.
Icecap Note: The environmentalists are worried with recent news of cooling, talk of future cooling due to the multidecadal ocean cycles and the sun, an arctic ice that has bounced back to highest level in 4 years and off western Greenland in 15 years. This push is not at all motivated by concern for the polar bears but as a maneuver to block any drilling for oil off Alaska and to facilitate state and federal government legislation action against the power industry and other sources carbon dioxide, now incorrectly listed as a pollutant. Technically this would even allow the government to tax you for using your lawnmower. Hopefully the Interior Department decision makers will see past the seriously flawed papers presented in support of the danger and heed the real experts and the real peer reviewed papers on this issue and have the courage to make the right decision.
By Roger Pielke Jr., Prometheus
If global cooling over the next few decades is consistent with model predictions, then so too is pretty much anything and everything under the sun.
This means that from a practical standpoint climate models are of no practical use beyond providing some intellectual authority in the promotional battle over global climate policy. I am sure that some model somewhere has foretold how the next 20 years will evolve (and please ask me in 20 years which one!). And if none get it right, it won’t mean that any were actually wrong. If there is no future over the next few decades that models rule out, then anything is possible. And of course, no one needed a model to know that.
Don’t get me wrong, models are great tools for probing our understanding and exploring various assumptions about how nature works. But scientists think they know with certainty that carbon dioxide leads to bad outcomes for the planet, so future modeling will only refine that fact. I am focused on the predictive value of the models, which appears to be nil. So models have plenty of scientific value left in them, but tools to use in planning or policy? Forget about it. Read more here.
Icecap Note: This relates of course to the paper in Nature that suggest cooling may occur til around 2020 due to ocean changes, something we have talked about here on Icecap for many months. Recall recently Smith et al from UK Met Office & Hadley Center in Nature 2007 made a bold prediction that in the next decade half the years after 2009 will be warmer than the ‘hottest year’ which is 1998 based on models. Models recently were rerun at NASA Goddard to try and explain why the ozone hole wasn’t vanishing and to no surprise they found with better modeling they now see the light and that the hole won’t start shrinking til 2018 and disappear til 2068. The modelers can find a way to show anything. As the famous mathematical physicst von Neumann said “If you allow me four free parameters I can build a mathematical model that describes exactly everything that an elephant can do. If you allow me a fifth free parameter, the model I build will forecast that the elephant will fly.” That is by the way why many of us more senior climatologists and meteorologists prefer to work with real data and correlate factors with real data than depend on models.
By Stephen McIntyre, Climate Audit
Last year, Ross McKitrick proposed the ironic idea of a “T3 Tax” in which carbon tax levels were related to observed temperature increases in the tropical troposphere. Temperature increases in the tropical troposphere are, as I understand it, a distinctive “fingerprint” for carbon dioxide forcing. Apparent discrepancies between a lack of warming in satellite data and surface warming have been a battleground issue for many years. In one of the most recent surveys of the matter in 2006, the U.S. CCSP proclaimed that the issue had been put to rest:
“Previously reported discrepancies between the amount of warming near the surface and higher in the atmosphere have been used to challenge the reliability of climate models and the reality of human induced global warming. Specifically, surface data showed substantial global-average warming, while early versions of satellite and radiosonde data showed little or no warming above the surface. This significant discrepancy no longer exists because errors in the satellite and radiosonde data have been identified and corrected. New data sets have also been developed that do not show such discrepancies.”
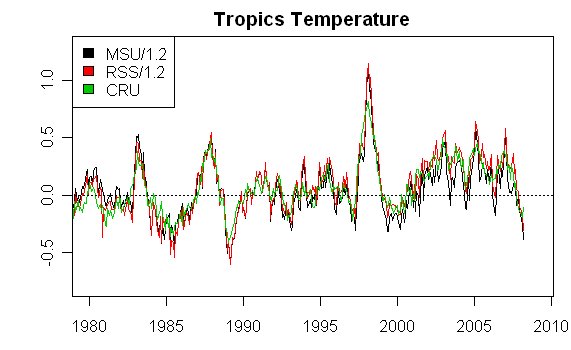
In this respect, the March 2008 satellite data for the tropics is pretty interesting. The graph below shows UAH (black) and RSS (red) for the tropics (both divided by 1.2 to synchronize to the surface variations - an adjustment factor that John Christy said to use in an email). I also collated the most recent CRU gridded data and calculated a tropical average for 20S to 20N, shown in green. All series have been centered on a common interval.
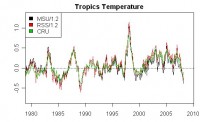
Tropical Troposhoeric Temperatures through March 2008. See larger image here
There have only been a few months in the past 30 years which have been as cold in the tropical troposphere as March 2008 four months in the 1988-1989 La Nina. At present, there is no statistically significant trend for the MSU version. The data set has very high autocorrelation. See full post here.