By John Goetz, on Climate Audit
In February I wrote a post asking How much Estimation is too much Estimation? I pointed out that a large number of station records contained estimates for the annual average. Furthermore, the number of stations used to calculate the annual average had been dropping precipitously for the past 20 years. One was left to wonder just how accurate the reported global average really was and how meaningful rankings of the warmest years had become.
One question that popped into my mind back then was whether or not - with all of the estimation going on - the historical record was static. One could reasonably expect that the record is static. After all, once an estimate for a given year is calculated there is no reason to change it, correct? That would be true if your estimate did not rely on new data added to the record, in particular temperatures collected at a future date. But in the case of GISStemp, this is exactly what is done. Last September I noted that an estimate of a seasonal or quarterly temperature when one month is missing from the record depends heavily on averages for all three months in that quarter.
On March 29 I downloaded the GLB.Ts.txt file from GISS and compared it to a copy I had from late August 2007. I was surprised to find several hundred differences in monthly temperature. Intrigued, I decided to take a trip back in time via the “Way Back Machine”. Here I found 32 versions of GLB.Ts.txt going back to September 24, 2005.
On average 20% of the historical record was modified 16 times in the last 2 1/2 years. The largest single jump was 0.27 C. This occurred between the Oct 13, 2006 and Jan 15, 2007 records when Aug 2006 changed from an anomoly of +0.43C to +0.70C, a change of nearly 68%. Wow.
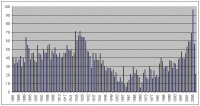
The next question I had was “how often are the months within specific years modified?” As can be seen in the next chart, a surprising number of the earliest monthly averages are modified time and again.

See larger graph here
It is at this point I would like to ask, does anyone have a copy of the GISS monthly and annual temperatures - the equivalent to GLB.Ts.txt - from a date earlier than Sep. 24, 2005? In the meantime, will the real historical record please stand up?
Read more here.
By Roger Pielke Sr, Climate Science
In the March 25 2008 issue of EOS, there was a News item by Marco Tedesco titled “Updated 2008 Surface snowmelt Trends In Antarctica”. It reports the following
Surface snowmelt in Antarctica in 2008, as derived from spaceborne passive microwave observations at 19.35 gigahertz, was 40% below the average of the period 1987-2007. The melting index (MI, a measure of where melting occurred and for how long) in 2008 was the second-smallest value in the 1987-2008 period, with 3,465,625 square kilometers times days against the average value of 8,407,531 km2 days (Figure 1a). Melt extent (ME, the extent of the area subject to melting) in 2008 set a new minimum with 297,500 square kilometers, against an average value of approximately 861,812 square kilometers. The 2008 updated melting index and melt extent trends over the whole continent, as derived from a linear regression approach, are -164,487 km2 days per year (MI) and -11,506 square kilometers per year (ME), respectively.
Negative trends for the period 1987-2008 of the number of melting days (Figure 1b) over the Antarctic Peninsula are observed at a rate down to -2 days per year for internal areas and about -0.7 days per year for coastal areas. Contrarily, positive trends (up to approximately +0.25 days per year) are observed on part of the Larsen Ice Shelf.
In East Antarctica, positive trends are observed over the Amery, West, Shackleton, and Voyeykov ice shelves, with values of up to +0.7 days per year for Shackleton and +0.8 days per year for Amery. Interestingly, the latter shows negative trends (down to -0.3 days per year) for internal areas but positive values for coastal areas.
Large-scale monitoring of ice shelves is an important task for many reasons: Though ice shelves do not contribute directly to sea level rise, they play an important role in keeping the warm marine air at a distance from glaciers; and recent observations also suggest the buttressing effect of ice shelves in preventing acceleration of ice sheets. An increasing surface snowmelt over ice shelves might lead to persisting melt ponds, which, in turn, might contribute to ice shelf disintegration as liquid water fills small surface cracks. Depending on the amount of water and the depth of a crack, the water can deepen the crack and eventually wedge through the ice shelf. Along with surface processes, it is imperative to focus on verifying hypotheses regarding those processes occurring at the ice-ocean boundaries, such as, for example, the thinning of ice shelves driven by ocean-induced melting.
A color version of Figure 1 can be viewed in the electronic supplement to this Eos issue (http://www.agu.org/eos_elec).
This report seems to have otherwise been missed by the media (I could not find articles in a search on google news), but it consistent with the recent colder than average tropospheric temperatures in the Southern Hemisphere. The finding that
“The melting index (MI, a measure of where melting occurred and for how long) in 2008 was the second-smallest value in the 1987-2008 period” is quite an important observation and further reinforces what is at least a short term cooling of the climate system.
See more here.
By Steve McIntyre, Climate Audit
Hadley Center, authors of the pre-eminent temperature series, have suddenly identified an “error” in how they presented temperature data. For presentation of their smoothed temperature series in a part-year situation, their methodology calculated the average of months then available and used that to estimate the current year’s temperature for presentation purposes. For their influential graphic showing smoothed temperature series, they used a 21-point binomial filter (this is reported) extrapolating the latest number for 10 years. This obviously places a lot of leverage on January and February temperatures. (UC has replicated their smoothing method; he sent me code and I’ve confirmed that we can exactly replicate their smoothing methods.)
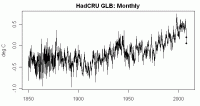
As has been widely reported, January and February 2008 temperatures are noticeably lower than last years. Here is a plot of Hadley Center GLB monthly temperatures, showing the two 2008 months in bold points. This ties into the monthly plot at the HadCRU site.

See larger image here
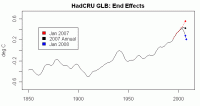
These cold January and February 2008 temperatures have led to a noticeable downturn in the smoothed annual series. This has not escaped the notice of the Hadley Center, who were extremely quick off the mark to notice an “error” which resulted in graphical emphasis of a downturn (here)

See larger image here
The blue dots below show the effect of the CRU smoothing method used in 2007 incorporating Jan and Feb 2008 - showing the downturn, which caused the Hadley Center to notice the “smoothing error”. The black shows the present annual series - not using 2008 data - which is what is currently displayed on the Hadley Center website (prettied up and with pseudo “error” bars.) The red dots show what their 2007 method would have yielded in February 2007, at the time of the IPCC WG1 conference. They noticed the “smoothing error” like a dog on a bone when temperatures went down, but didn’t notice precisely the same “error” last year, when it yielded record high results. Looks like there are some pit bulls in England as well. Read full post and comments here. See Anthony Watts thoughts on this same “error” correction here.
By Joseph D’Aleo, CCM
Misguided AGW evangelists like James Hansen and environmental groups have managed to get 59 coal power plants to be not approved across the US last year alone. Environmental groups do not consider nuclear power, a clean energy source as an alternative. They don’t want us to be dependent on foreign oil but never will allow us to drill off Alaska (especially if polar bears are declared endangered). There hasn’t been a refinery built in the US since Jimmy Carter was in office in 1977.
They say we need to increase conservation and move to alternative energy sources. I have always supported conservation and have heard the clarion call for alternative energy sources for decades. Their development and use has been cost prohibitive and they each have their own set of problems.
Hydropower is a major source of clean energy and tidal power may be a partial answer near some coasts and rivers. Wind and solar are local partial solutions only. Look at what happened in Texas when they built wind turbines in West Texas and were depending on them to meet the electricity needs of Houston and Dallas. This winter when a cold front blew through and the winds went calm, the lights went out in Dallas and Houston. The sun doesn’t always shine nor does the wind always blow and in drought years, hydroopower may underdeliver.
Ethanol is not the answer. It uses more energy to produce than it saves, gives off more CO2 and robs the world of a food supply driving prices for grain, and grain fed animals up. As well as all products that use soy oil and corn oil.
We are going to need all the power sources we can possible muster. The marketplace may innovate some solutions that will help conserve and increase efficiency and alternative energy may become a partial solution but we can’t depend on that to meet our ever increasing needs. We should be building coal plants like the Chinese and nuclear like the French and the UK. We should be looking at gasification/liquification of coal and continue work on technologies to clean up effluence. We should use natural gas a very clean and efficient fuel. We need to build new gasoline processing plants.
If the oceans continue to cool and the sun goes to sleep and temperatures take a dive, rolling brownouts and blackouts and restricted usage will be part of the future. Many of us will be living in cold houses in winter and uncomfortably warm ones in summer and many poor families will have to decide whether to heat or eat. The number of deaths from cold and heat will increase not because of global warming but because we took unnecessary steps to address a problem that doesn’t exist.
By Roger Pielke Sr. Climate Science
Anthony Watts is performing a seminal service to the climate community in leading the effort to document the immediate environment around surface temperature monitoring sites that are used to construct multi-decadal surface temperature trends and anomalies. His data and analyses for the sites can be found at Weather Stations. The current Climate Science weblog is to recognize this essential contribution.
This analysis should be led by Tom Karl at the National Climate Data Center (NCDC), however, he has, unfortunately, ignored recommendations to do this (e.g see). Thus while we hear several times a year from NCDC (e.g. see) how the temperatures rank relative to other years, the large obvious problems with the historical climate reference network, that Anthony and his outstanding volunteers have shown, should be a wake-up call to the media and to the public that they are being provided temperature information by NCDC that is not spatially representative of actual temperature anomalies over the USA, and likely has a significant warm bias.
Anthony - keep up the good work!
Icecap Note: Roger is exactly right. Anthony and his band of volunteers are doing extremely important work. At least half a dozen peer review studies by Roger and others have shown that problems with observations or improper adjustments to the observations may account for 30-50% of the warming observed in the last century.
By Sandy Shore, AP Business
Forget baseball and spring flowers. The nation’s ski resorts are all about skiing and snowboarding - still. Snow fell Monday in parts of the country including Colorado and Vermont, capping a bountiful winter that could lead to a record-setting season for the $6 billion industry. A year ago, resorts posted a 7 percent drop in visitors nationwide because of a fickle winter.
“It’s actually been one of those rare years where it’s been winter from coast to coast,” said Michael Berry, president of the National Ski Areas Association. “It may very well be a record year.” In the Rockies, mild weather hurt resorts in November and early December, but heavy snowfall since then has proved a boon for business. Resorts of all sizes on the West Coast, the Midwest and the Northeast area have had strong numbers, Berry said.

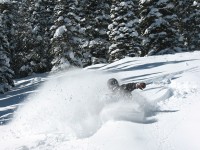
In Colorado, several resorts saw nearly 2 feet of fresh snow last weekend, including 15 inches at Vail, 19 inches at Beaver Creek (above) and 18 inches at Steamboat Springs. Aspen Highlands, Monarch, Purgatory and Wolf Creek ski areas all have extended their seasons. In Vermont, it was “snowing like crazy” Monday, said Tori Ossola of the trade group, Ski Vermont, whose resort members are optimistic about besting the typical skier visit total that ranges between 4.2 million and 4.5 million each season.
A year ago, Vermont and other ski areas in the eastern United States had a slow start to the season as stingy snowfall hurt business on holiday weekends. Ossola said this year was the opposite with heavy snow falling before Thanksgiving, Christmas and Martin Luther King Day. “We had all of the major holidays covered and it seems like Mother Nature was making up for what she did to us last year,” she said. “The timing of the storms was just perfect.” Read more here.
By Roger Pielke Sr. Climate Science
There continues to be misunderstandings on my viewpoint on the role of humans within the climate system. This weblog is written to make sure it is clear, and can be used whenever someone asks the question as to where does Pielke Sr. stand on this issue.
“Humans are significantly altering the global climate, but in a variety of diverse ways beyond the radiative effect of carbon dioxide. The IPCC assessments have been too conservative in recognizing the importance of these human climate forcings as they alter regional and global climate."and that “attempts to significantly influence regional and local-scale climate based on controlling CO2 emissions alone is an inadequate policy for this purpose.”
Natural climate variations and change, have also been underestimated (and are only poorly understood) based on examination of the historical and paleo-climate record (see here and here).
Policies that focus on CO2 by itself are ignoring definitive research results (such as reported in the 2005 National Research Council report) that humans have a much broader influence on the climate system than was communicated in the 2007 IPCC report. To neglect these other climate forcings represents a failure by policymakers (and the media) to utilize this scientifically robust information.
The neglect of including the diversity of human climate forcings indicates that the real objective of those promoting the radiative effect of the addition of atmospheric CO2 as the dominate human climate forcing is to promote energy and lifestyle changes. Their actual goal is not to develop effective climate policies. Read the full blog here.
Andre Bernier’s Newsroom, My Fox Cleveland
The following thanks to Marc Morano, Communications Director, Senate Environment and Public Works Committee, Washington D.C
CBS News 60 Minutes is pressing Gore on skeptics. Gore knows he is facing serious backlash from the scientific community and peer-reviewed studies. 2007 and now 2008 are overwhelmingly turning into the “tipping points” for climate alarmism as new peer-reviewed studies continue to debunk rising CO2 fears, a U.S. Senate minority report reveals nearly 500 scientists dissented from man-made climate fears, and more and more scientists continue in 2008 to declare themselves skeptical of a man-made climate “crisis.”
The Earth’s failure to continue warming has also confounded promoters of man-made climate fear. Here is a mere sampling of inconvenient developments for climate alarmists in 2008 alone:
(1) Oceans Cooling! Scientists puzzled by “mystery of global warming’s missing heat"- LINK
(2) New Data from NASA’s Aqua satellite is showing “greatly reduced future warming projected as a consequence of carbon dioxide."- LINK
(3) Former NASA Climatologist Dr. Roy Spencer found not one peer-reviewed paper has ‘ruled out a natural cause for most of our recent warmth’ - LINK
(4) UN IPCC in ‘Panic Mode’ as Earth Fails to Warm, Scientist says - LINK
(5) UN IPCC Chairman Rajendra Pachauri “to look into the apparent temperature plateau so far this century."- LINK
(6) New scientific analysis shows Sun “could account for as much as 69% of the increase in Earth’s average temperature” - LINK
(7) An International team of scientists released a March 2008 report to counter UN IPCC, declaring: “Nature, Not Human Activity, Rules the Climate” - LINK
(8) MIT Climate Scientist Dr. Richard Lindzen’s new analysis finds the Earth has had “No statistically significant warming since 1995."- LINK

Visit Andre Bernier’s blog here.


