


By David Whitehouse, The Independent
’The fact is that the global temperature of 2007 is statistically the same as 2006 and every year since 2001.
Global warming stopped? Surely not. What heresy is this? Haven’t we been told that the science of global warming is settled beyond doubt and that all that’s left to the so-called sceptics is the odd errant glacier that refuses to melt?
Aren’t we told that if we don’t act now rising temperatures will render most of the surface of the Earth uninhabitable within our lifetimes? But as we digest these apocalyptic comments, read the recent IPCC’s Synthesis report that says climate change could become irreversible. Witness the drama at Bali as news emerges that something is not quite right in the global warming camp.
The fact is that the global temperature of 2007 is statistically the same as 2006 as well as every year since 2001. Global warming has, temporarily or permanently, ceased. Temperatures across the world are not increasing as they should according to the fundamental theory behind global warming - the greenhouse effect. Something else is happening and it is vital that we find out what or else we may spend hundreds of billions of pounds needlessly. Read more here.
David Whitehouse was BBC Science Correspondent 1988-1998, Science Editor BBC News Online 1998-2006 and the 2004 European Internet Journalist of the Year. He has a doctorate in astrophysics and is the author of The Sun: A Biography (John Wiley, 2005).
By Steve McIntyre, Climate Audit
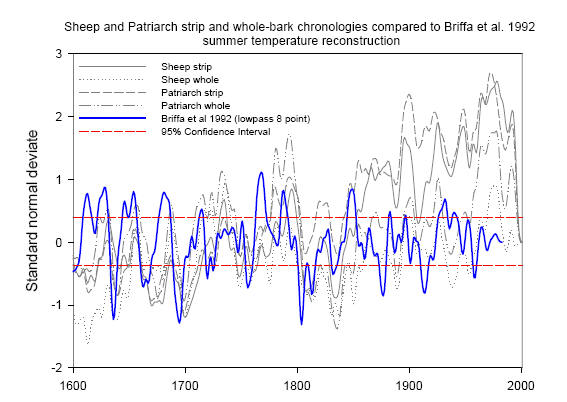
Malcolm Hughes (coauthor Matthew Salzer) made a presentation entitled “Twentieth Century Bristlecone Pine Tree Rings near Upper Tree Limit Wider than in Recent Millenniaâ€. This included a report on Sheep Mountain. He showed a picture of Matthew Salzer on Sheep Mountain and praised his work. He said that there was no difference between strip bark and whole bark chronologies and showed a graphic up to 2005 with relatively wide recent ring widths. Linah Ababneh’s name did not pass his lips (the Ababneh thesis showing non-nomalous 20th results discussed here, here and here), nor did he discuss her work. In Ryan Maue’s felicitous phrase, it was as though she had been put in witness protection. made a presentation entitled “Twentieth Century Bristlecone Pine Tree Rings near Upper Tree Limit Wider than in Recent Millenniaâ€. This included a report on Sheep Mountain. He showed a picture of Matthew Salzer on Sheep Mountain and praised his work. He said that there was no difference between strip bark and whole bark chronologies and showed a graphic up to 2005 with relatively wide recent ring widths. Linah Ababneh’s name did not pass his lips (the Ababneh thesis showing non-nomalous 20th results discussed here, here here), nor did he discuss her work. In Ryan Maue’s felicitous phrase, it was as though she had been put in witness protection. For reference, here is Linah Ababneh’s plot showing a material difference:
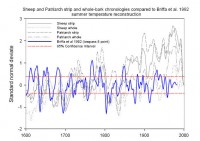
For full size image go here.
Linah Ababneh’s result are different than the results presented at AGU. Malcolm Hughes was on Linah Ababneh’s thesis committee but did not mention her work which arrived at different conclusions than the ones presented here. Linah Ababneh’s thesis said that the data would be archived at ITRDB, but Hughes and her other thesis supervisors did not archive the data. David Meko said that they had lost track of Ababneh although she was easily located. When asked about the data by a CA reader, she said that she had legal advice not to provide the data to me.
Why didn’t Hughes acknowledge the efforts of Linah Ababneh in collecting Sheep Mt data, while acknowledging the efforts of Matthew Salzer? Why didn’t he discuss her conflicting results? For the full blog go here.
Icecap Note: For those unaware, Hughes was a coauthor with Mann and Bradley of the original ‘hockey stick’ study in 1998 featured extensively in the IPCC 3rd Assessment. Steve McIntyre’s detective work with regards to the data and methods helped discredit that work and the hockey stick vanished from the latest IPCC report. The hockey stick did away with the Medieval Warm Period and subsequent Little Ice Age and exaggerated the recent warming. Steve’s work and the good work of the Idsos on CO2 Science have exposed the errors and shown strong support for the Medieval Warm period, the Little Ice Age and for less recent warming.
By Bob Ferguson, SPPI
The press out of Bali today includes coverage of a World Wildlife Fund (WWF) report about the fate of penguin species under climate change. The press reports draw heavily from the press release put out by the WWF to draw attention to their report on penguins, but more importantly, the WWF’s desire for large and immediate carbon dioxide emissions restrictions. From the press reports and the WWF release, things seem bad for Antarctica’s penguin species. But, as is the case with nearly every alarmist issue, the truth reveals quite a different story. In this case, a review of the literature on penguins, climate change, and ecosystem disturbances, reveals a large variety of penguin responses to changing conditions, changes that include in addition to climate fluctuations, a large-scale alteration to the local and regional food chain as industrial whaling and fishery operations over the course of the past several decades have significantly reduced the number of many species, including both predators and prey. This perturbation to the foodweb has likely had large impacts on the resident penguin species and makes isolating or even correctly identifying impacts from a changing climate quite difficult (Ainley et al., 2007). See full story here.
World Climate Report
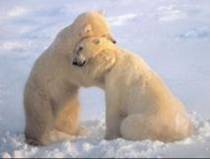
We’ve been talking til we’re blue in the face about how the very existence of polar bears today is the strongest evidence possible that they should manage, as a species (although some individual populations may struggle), to hold their own in a warming climate. Why is this? Because their existence today is proof that they survived long periods of time (many thousands of years on end), when the climate of their Arctic habitat was warmer (and thus likely more ice-free) than conditions are now, and will be into the future. But, in case you were withholding final judgment until you heard it from someone else, well, here you go:
What may be the oldest known remains of a polar bear have been uncovered on the Svalbard archipelago in the Arctic. The jawbone was pulled from sediments that suggest the specimen is perhaps 110,000 or 130,000 years old. Professor Olafur Ingolfsson from the University of Iceland says tests show it was an adult, possibly a female. The find is a surprise because polar bears are a relatively new species, with one study claiming they evolved less than 100,000 years ago. We have this specimen that confirms the polar bear was a morphologically distinct species at least 100,000 years ago, and this basically means that the polar bear has already survived one interglacial period, explained Professor Ingolfsson. And what’s interesting about that is that the Eeemian - the last interglacial - was much warmer than the Holocene (the present).
Will this new finding by Professor Ingolfsson put folk’s minds at ease and quiet the talk of the bear’s imminent extinction? Hardly. After all, the ultimate goal of such talk is not the survival of the polar bear, but the restriction of mankind’s activites on earth. And such fervent desire is not easily doused.
By David Douglas, U of Rochester, John Christy, U of Alabama, Fred Singer, U of Virginia
Climate scientists at the University of Rochester, the University of Alabama, and the University of Virginia report that observed patterns of temperature changes ("fingerprints") over the last thirty years are not in accord with what greenhouse models predict and can better be explained by natural factors, such as solar variability. Therefore, climate change is “unstoppable” and cannot be affected or modified by controlling the emission of greenhouse gases, such as CO2, as is proposed in current legislation. These results are in conflict with the conclusions of the United Nations Intergovernmental Panel on Climate Change (IPCC) and also with some recent research publications based on essentially the same data. However, they are supported by the results of the US-sponsored Climate Change Science Program (CCSP).
Lead author David Douglass said: “The observed pattern of warming, comparing surface and atmospheric temperature trends, does not show the characteristic fingerprint associated with greenhouse warming. The inescapable conclusion is that the human contribution is not significant and that observed increases in carbon dioxide and other greenhouse gases make only a negligible contribution to climate warming. Co-author John Christy said “Satellite data and independent balloon data agree that atmospheric warming trends do not exceed those of the surface. Greenhouse models, on the other hand, demand that atmospheric trend values be 2-3 times greater. We have good reason, therefore, to believe that current climate models greatly overestimate the effects of greenhouse gases. Satellite observations suggest that GH models ignore negative feedbacks, produced by clouds and by water vapor, that diminish the warming effects of carbon dioxide.” The report is published in the December 2007 issue of the International Journal of Climatology of the Royal Meteorological Society [DOI: 10.1002/joc.1651].
By Lubos Motl, The Reference Frame
RSS MSU satellite data for the lower troposphere show that November 2007 was the coldest month since January 2000. Other major teams that measure the global mean temperature have not yet published their November data. The temperature anomaly was -0.014 °C. It means that the whole month was actually cooler than the the average recorded November. It was the first month in this century that was cooler than average.
The continuing La Nina is the main reason behind the recent cold months; La Nina is expected to disappear in Spring 2008. January 2000, a month that was even cooler than November 2007, witnessed a La Nina, too. November 2007 was also a whopping 0.915 °C colder than April 1998. Another reason could be an inactive Sun. We are expecting the solar cycle 24 to begin soon but it takes a longer time than expected and there are still almost no sun spots. Via a crucial mechanism, it means that we should be getting more galactic cosmic rays that should create more clouds.
It will end up colder than all other years in the 21st century so far as well as 1998 (by 0.4 °C) and 1995. Other teams (HadCRUT3, UAH MSU) except for GISS will also report 2007 to be between the 6th and 9th warmest year. Dr James Hansen’s GISS deviates substantially - it may even announce that 2007 was the warmest year - and their method to measure temperature based on stations is probably dominated by urban heat islands and the results are most likely complete rubbish. See full blog here. See recent story by McKitrick and Michaels on the warm bias in the global data bases issue here.
By Dr. Tim Ball, NSRP
Exploitation of fear by environmental groups was explained well in Crichton’s book, State of Fear. He could also have written a book titled, State of Knowledge. Most people know very little about the natural world and how it works. This lack of knowledge is easily exploited and coupled with fear makes it an even more powerful manipulative tool. The idea that knowledge is power isn’t new, but that is the positive side. Lack of knowledge is the negative side and makes you very vulnerable. As Derek Bok said, “If you think education is expensive - try ignorance.” Ignorance allows presentation of natural events as unnatural or normal events as abnormal. Arctic ice conditions are a perfect example.
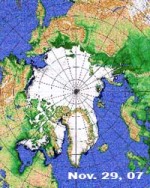
Notice how much ice has already formed this winter, a more rapid growth than previously in the record. It was claimed the summer ice was the smallest on record but the valid record is short coincides with arrival of satellite data in 1980. While the media raised alarms over Arctic ice melt, they did not report that Antarctic winter sea ice extent was the greatest on record. Read more here.
Dr. Ball is a renowned environmental consultant and former climatology professor at the University of Winnipeg. Dr. Ball employs his extensive background in climatology and other fields as the Chairman of Natural Resources Stewardship Project.
By Robert Ferguson, SPPI
On October 18, 2007, The Kansas Department of Health and Environment rejected a request to build two new 700-megawatt coal-fired electricity generating power plants, citing concerns over the contribution of the proposed plants’ carbon dioxide emissions to climate change and “the potential harm to our environment and health.” In making this finding, the Kansas Department of Health and Environment had to ignore all of the known climate history of the state of Kansas, established climate science as well as the climate model projections for the future climate of the state of Kansas. Both observations and projections clearly demonstrate that:
- Kansans have neither experienced nor are predicted to experience negative effects from climate variations and trends
- There have been no overall changes in temperatures during the past 75 years
- Total precipitation has increased slightly, making more water available for all to use
- The frequency and severity of drought has decreased
- Kansan’s sensitivity to heat-waves has declined
- The number of severe storms, such as tornadoes is relatively unchanged
- “Tropical” diseases such as malaria, dengue fever, or West Nile Virus have been erroneously predicted to spread due to global warming
- Future projections indicate that Kansas will be less impacted by rising global temperatures than any other state in the country
China alone opens a new coal-fired plant every 4 - 7 days, any Kansas-derived “savings” of CO2 emissions into the atmosphere will be made up in a matter of days, effectively exporting emissions and jobs overseas. These facts make it inconceivable that the Kansas Department of Health and Environment would, on spurious grounds of “climate change,” deny the application to add more generating power aimed towards reducing the cost and insuring an abundant future supply of electricity, prosperity and general well-being to Kansans. Read more here.