


By John Goetz, Climate Audit, Watts Up With That
After I posted GISS Spackle and Caulk, a number of commenters marveled at the symmetry of the histogram (GISS temperature estimate minus actual temperature). Some were dismayed that there was not a clear warming bias in the plot. Others were giddy for the very same reason. A few noted (as I hoped) that the differences tended to be rather large, but most seemed content with the fact GISS could hit the side of a barn from five feet.
No one should be surprised with the shape of the histogram. The “simulation” I performed required that all three months be available in a specific season for a specific station in order to calculate an estimate and compare it to the real value. For example, if summer 1957 was being tested, I needed June, July and August. If August were missing, the GISS algorithm would not be able to estimate June or July, and I would not have a real August to look at either. With all three months available, I forced symmetry into the result. For every over-estimated August I needed a corresponding under-estimated June or July. The algorithm demanded that if I estimate all three months, their average must match the true average.
However, that is akin to saying that if I flip a coin often enough, the number of heads will be roughly equal to the number of tails. As most of us have experienced, coin flipping can be quite streaky. It is not uncommon to flip eight heads in a row. But having flipped that many heads does not change the probability of the next coin flip. And so it goes with temperatures. In the actual application of the GISS algorithm, at most one month in a season can be estimated, so symmetry is not guaranteed. If one month is estimated more than another, it might be possible to introduce asymmetry.
As chance would have it, one specific month-year GHCN entry has had its temperature estimated by GISS far more than any other combination in the record. And as luck would have it, we have real GHCN data to compare against those estimates.
As has been noted repeatedly on this blog, MCDW records began replacing most non-US temperature records in the late 1980s. Most of the MCDW records begin in January 1987, and the records they replace generally end between December 1989 and December 1990. During the period of overlap, the MCDW records usually match exactly those that they replace. In a few cases they might differ by one or two tenths of a degree in the occasional month.
When an MCDW month begins in January 1987, the winter season temperature (DJF) is missing the December 1986 value, so GISS must estimate it. But the record that MCDW replaces contains a real, live December value. This means that, when an MCDW record agrees with an existing record during the period of overlap, the real December value can be compared against the estimate from MCDW. So of course I looked at this for all GHCN records. Following is a histogram showing the GISS estimate of December 1986 minus the actual for GHCN stations in Europe and Russia. I will show other regions of the world in future posts. The reason I focus on this broad swath of land is that the resulting records are among the most lengthy available.
See larger image here
One might notice GISS under-estimates December 1986 for this region by a greater than 2 to 1 margin. By cooling the older record and leaving the current record unchanged, an enhanced warming trend is introduced. This is completely artificial, of course, because the actual December 1986 temperatures are available. In this case, GISS got their eight heads in a row. Read the full account here.
By Paul Chesser, Climate Strategies Watch
Ever read a story and think, “I can’t believe what I’m reading?” I had that experience this morning when I read this report in USA Today, with the headline ‘Psychologists determine what it means to think ‘green:’ Armed with new research into what makes some people environmentally conscious and others less so, the 148,000-member American Psychological Association is stepping up efforts to foster a broader sense of eco-sensitivity that the group believes will translate into more public action to protect the planet. “We know how to change behavior and attitudes. That is what we do,” says Yale University psychologist Alan Kazdin, association president. “We know what messages will work and what will not.”
From one research presentation: News stories that provided a balanced view of climate change reduced people’s beliefs that humans are at fault and also reduced the number of people who thought climate change would be bad, according to research by Stanford social psychologist Jon Krosnick.
His presentation will detail a decade of American attitudes about climate change. His new experiment, conducted in May, illustrates what he says is a public misperception about global warming. He says there is scientific consensus among experts that climate change is occurring, but the nationwide online poll of 2,600 adults asked whether they believe scientists agree or disagree about it.
By editing CNN and PBS news stories so that some saw a skeptic included in the report, others saw a story in which the skeptic was edited out and another group saw no video, Krosnick found that adding 45 seconds of a skeptic to one news story caused 11% of Americans to shift their opinions about the scientific consensus. Rather than 58% believing a perceived scientific agreement, inclusion of the skeptic caused the perceived amount of agreement to drop to 47%.
American Psychological Association leaders say they want to launch a national initiative specifically targeting behavior changes, including developing media messages that will help people reduce their carbon footprint and pay more attention to ways they can conserve. They want to work with other organizations and enlist congressional support to help fund the effort.
I don’t think I really need to add any other commentary other than that now the “greening of education” doesn’t stop at the grade school-through-college vehicles—it can be legitimately called an all-out propaganda effort that will include brainwashing by psychoanalysts.
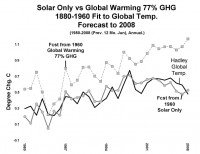
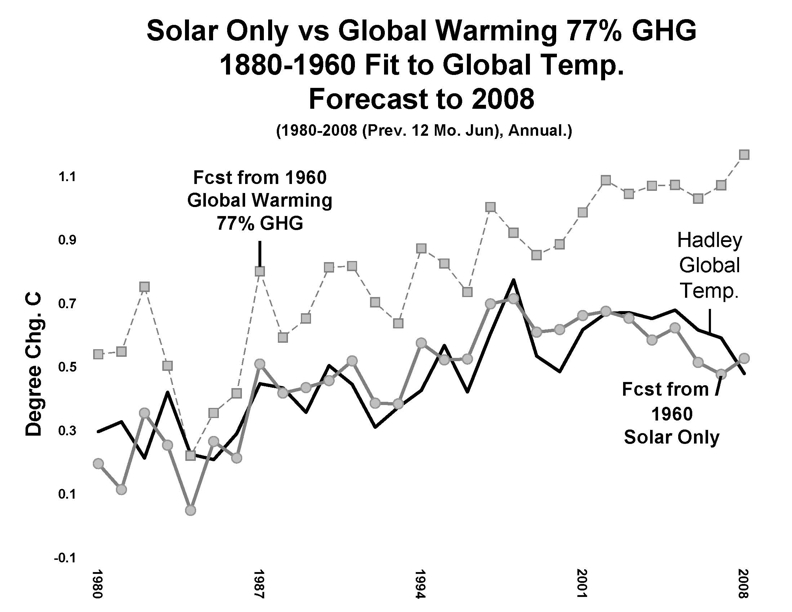
By John Zyrkowski, Author of Its the Sun Not Your SUV
From the Foreword by Peter Dietze, 2001 IPCC Reviewer
Global temperatures have increased since 1880, up on average by 0.6C in 1997-00. Temperatures have declined for the last decade by 20%. New data show that solar impacts have increased by the same amount and follow the zigzags in temperature from 1935 to 1970 and this last decade’s decline. The report from the Intergovernmental Panel on Climate Change (IPCC) says that, based upon computer models, increased energy absorption by CO2 and other “greenhouse gases” (GHG) are overwhelmingly the basis for temperature increases.
But zigzag increases in global temperatures do not track with minor straight line increased energy absorption by GHG. Rather, such increases follow closely the major zigzag changes in solar impacts emanating from our sun, no different from the past millions of years as has been supported by multiple climatologists and other scientists. In short, if GHG play a role, it is minor in the 0.26% warming since 1880. The sun is responsible for the primary change, and political fixes such as envisaged in the Kyoto Treaty will not change global temperatures measurably but will mean a drastic decrease in worldwide output of goods, with calamitous effects on millions of people who are ill-prepared to suffer immense decreases in their standards of living.
John Zyrkowski begins with the irrefutable, uncontested raw data available from governmental sources on temperature fluctuations, solar impacts of radiation and magnetic flux, and CO2 absorption rates. He then uses Excel functions to demonstrate that the IPCC report used by proponents of the human cause of global warming is fatally flowed. The data doesn’t provide the answer the IPCC said it would. The worst case increase from GHG is 0.45 C. See more here.
See larger image here.
By John Goetz on Climate Audit
Earlier this year I did a post on the amount of estimation done to the GHCN temperature record by GISS before generating zonal and global averages. A graphic I posted compared the amount of real temperature data with the amount of estimation over time. To read the graphic, consider 2000 as an example. As of February 7, 2008 there were 3159 station records in the GHCN data with an entry for the year 2000. Of those station records, 62% were complete and an annual average could be fully calculated. Another 29% were incomplete, but contained enough monthly data that the GISS estimation method kicked in. The final 9% were so incomplete that no estimation could be done.
What I did not explore at the time and would like to look more closely here is the accuracy of the estimation. One would hope with so much infilling going on that the accuracy would be rather high (I will leave the determination of “high accuracy” for a later time). Because I did not have real data to compare with the GISS estimations, I took another approach. I used the GISS method to estimate real temperature data as if that data were missing.
Recall that GISS never explicitly estimates missing monthly temperatures. What they do is estimate seasonal averages when one monthly temperature is missing but the other two are present. Similarly, an annual temperature can be estimated when one seasonal value is missing but the other three are present. Using this methodology GISS can estimate an annual temperature when as many as six monthly values are missing.
Now to test the estimation accuracy. In Connecticut, December 2006 was warmer than normal, but February 2007 was colder than normal. Looking at the records for Hartford, CT, we see the following monthly and seasonal temperatures:
Dec 2006: 3.3
Jan 2007: -0.3
Feb 2007: -4.6
DJF: -0.5
If the December 2006 record were missing from Hartford, GISS would estimate a value of -0.7 C, which would yield a seasonal average of -1.9 C. Similarly, if February 2007 were missing, GISS would estimate it at 1.7 C and produce a seasonal average of 1.6 C. That’s a 4.0 degree miss for Dec, a 6.3 degree miss for February, and a 3.5 degree swing at the seasonal level.
The probability GISS will create an estimate within 0.4C of the actual value is 26.7%. A value between 0.5 C and 0.9 C has a 22.2% probability of occuring. Similarly, 1.0 C to 1.9 C is 26.5%, and 2.0 C to 2.9 C is 12.7%. There is about a 12% probability that the GISS estimate will be off by 3.0 C or more. See much more of this Goetz post here.
Icecap Note: This is a little like trying to figure out the final baseball score and who won the game when you only have information about some innings.

See larger image here.
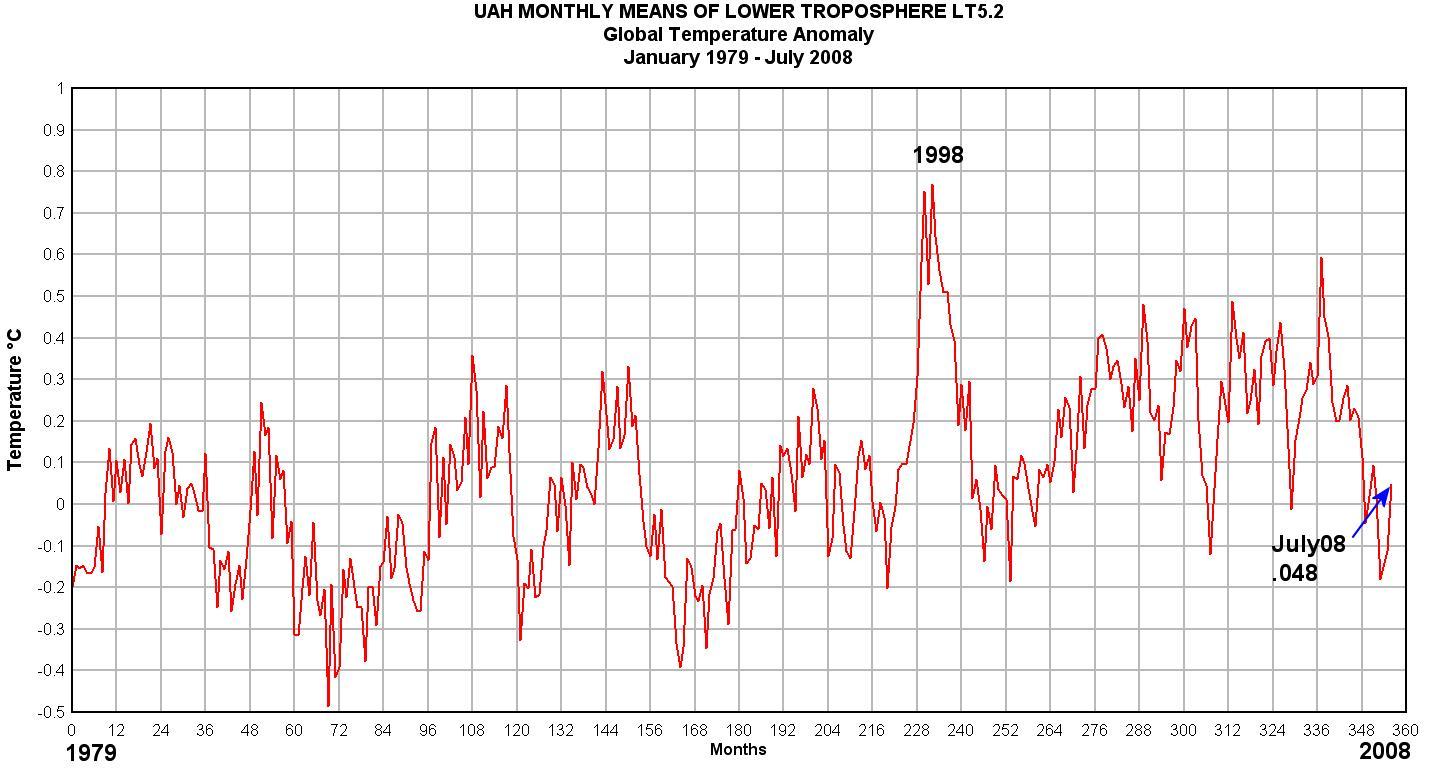
By Anthony Watts, Watts Up With That
UAH (University of Alabama, Huntsville) Microwave Sounder Unit (MSU) lower troposphere global temperature anomaly data for July 2008 was published today and has moved a bit above the zero anomaly line, with a value of 0.048, up from -0.114 in June 2008.
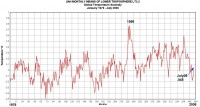
Reference: UAH lower troposphere data. See large image here
Steve McIntyre of Climate Audit did an interesting graph that shows the difference between the NH and SH using the UAH data in this post.
See larger image here
In general terms, the relative warming of the NH relative to the SH is something that we’re aware of, but isn’t the strength of the trend in the 30 years of satellite record astonishing? And this is nothing to do with UHI. We’re talking 0.75 deg C in 30 years here. I don’t recall this having been mentioned in advance a particular fingerprint of GHG forcing. It’s so prominent that you’d think that it would deserve a little comment in AR4 - has anyone noticed such a discussion - maybe they can point us to a page.
Also here’s the same plot from GISS annual data (24-90N minus 24-90S). Seems to me like I’ve seen a plot like this somewhere before and it caused apoplexy in Team-world.
See larger image here
By Edmund Contoski, columnist for FORCES International Liberty News Network
Manmade emissions of carbon dioxide were not significant before worldwide industrialization began in the 1940s. They have increased steadily since. Over 80% of the 20th century’s carbon dioxide increase occurred after 1940 - but most of the century’s temperature increase occurred before 1940! From 1940 until the mid-1970s, the climate also failed to behave according to the greenhouse hypothesis, as carbon dioxide was strongly increasing while global temperatures cooled. This cooling led to countless scare stories in the media about a new ice age commencing.
In the last 1.6 million years there have been 63 alternations between warm and cold climates, and no indication that any of them were caused by changes in carbon dioxide levels. A recent study of a much longer period (600 million years) shows - without exception - that temperature changes precede changes in carbon dioxide levels, not the other way around. As the earth warms, the oceans yield more carbon dioxide to the atmosphere, because warmer water cannot hold as much carbon dioxide as colder water.
The public has been led to believe that increased carbon dioxide from human activities is causing a greenhouse effect that is heating the planet. But carbon dioxide comprises only 0.035% of our atmosphere and is a very weak greenhouse gas. Although it is widely blamed for greenhouse warming, it is not the only greenhouse gas, or even the most important. Water vapor is a strong greenhouse gas and accounts for at least 95% of any greenhouse effect. Carbon dioxide accounts for only about 3%, with the remainder due to methane and several other gases.
Not only is carbon dioxide’s total greenhouse effect puny, mankind’s contribution to it is minuscule. The overwhelming majority (97%) of carbon dioxide in the earth’s atmosphere comes from nature, not from man. Volcanoes, swamps, rice paddies, fallen leaves, and even insects and bacteria produce carbon dioxide, as well as methane. According to the journal Science (Nov. 5, 1982), termites alone emit ten times more carbon dioxide than all the factories and automobiles in the world. Natural wetlands emit more greenhouse gases than all human activities combined. (If greenhouse warming is such a problem, why are we trying to save all the wetlands?) Geothermal activity in Yellowstone National Park emits ten times the carbon dioxide of a midsized coal-burning power plant, and volcanoes emit hundreds of times more. In fact, our atmosphere’s composition is primarily the result of volcanic activity. There are about 100 active volcanoes today, mostly in remote locations, and we’re living in a period of relatively low volcanic activity. There have been times when volcanic activity was ten times greater than in modern times. But by far the largest source of carbon dioxide emissions is the equatorial Pacific Ocean. It produces 72% of the earth’s emissions of carbon dioxide, and the rest of the Pacific, the Atlantic, the Indian Ocean, and the other oceans also contribute. The human contribution is overshadowed by these far larger sources of carbon dioxide. Combining the factors of water vapor and nature’s production of carbon dioxide, we see that 99.8% of any greenhouse effect has nothing to do with carbon dioxide emissions from human activity. So how much effect could regulating the tiny remainder have upon world climate, even if carbon dioxide determined climate? Read more here.
Dr. Lance Endersbee in Focus
Should we try harder to understand the causes of natural climate change instead of assuming present climate change is man-made? In the past, sea temperatures were obtained from measurements by passing ships in the sea lanes of the world. It is only in the past three decades that more accurate data on sea surface temperatures has become available. The analysis of this recent data by the author shows that: ¢ the oceans regulate the composition of the atmosphere; the influence on climate of human-generated carbon dioxide (CO2) in the atmosphere is negligible; and global climate change has natural causes. The oceans and the atmosphere are quite shallow in relation to the vast surface area of the oceans.
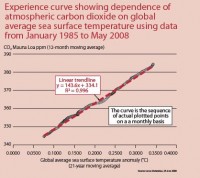
The interaction of the atmosphere and the oceans is essentially a phenomenon of the ocean surface. It would be expected that there would be almost a direct correlation between levels of CO2 in the air and the global mean sea surface temperatures, and that is the case. It is possible to plot an experience curve of the relationship between ocean temperatures and atmospheric CO2 levels. In order to do so it is necessary to recognise that the oceans have a vast storage capacity for heat and dissolved gases, and that changes are slow. On the other hand, the atmosphere has a much more rapid response time. If we use a 12-month moving average of atmospheric CO2 and a 21-year moving average of the more accurate recent data on global average sea surface temperatures, a remarkably clear experience curve is obtained. The 12-month moving average of CO2 levels filters out the variations of the annual cycle and, in related analyses, provides a view of the influence of other natural events. The 21-year moving average of sea surface temperature covers the complete solar cycle, including the change in magnetic polarity of the sun, the El Nino and La Nina influences on global climate, and recognises the vast storage capacity of the oceans for CO2 and the slow response time of the oceans.
The chart shows that the CO2 levels in the atmosphere and global average sea surface temperatures are locked together. The correlation is so firm it is reasonable to include it as a condition in the computer simulations used to study climate change.
Se larger image here
It is my view that the present fear of man-made climate change is quite mistaken. We should try harder to understand the real causes of natural climate change.
Will Alexander
My advice to climate alarmists is that now is an appropriate time to start planning your exit strategy. The whole IPCC/UNFCCC edifice is about to disintegrate. I described these events in my recent memos. My position during all these years has been very simple. I could find no evidence of unnatural changes in the officially published hydrometeorological records. In the attached memo, for the first time I go on the attack. Not only is there no believable evidence in the data to support climate alarmism, but the evidence refutes the IPCC’s claims and completely undermines its position.
I have attached two files, my memo and the evaporation histograms in file Evaporation.pdf. What is the future of climate alarmism and its associated research? There is none. The globe is cooling, the glaciers are advancing and Bangladesh is not being inundated by rising sea levels. Public interest is falling and the media are becoming more critical. The possibility of nations reaching agreement on meaningful actions to control, let alone reduce, their undesirable emissions is receding by the day. The basic science underlying the IPCC’s position is being eroded away, stone by stone.
There is a growing and very perceptible groundswell of public and scientific opinion that is questioning the very basis of climate alarmism. The alarmists are no longer dealing with a gullible public and ambitious poticians. Here in South Africa, we are going through turbulent times. Honest, conscientious and knowledgeable scientists have a professional and moral duty to examine the scientific basis for the alarmist claims and report their findings. The most efficient method to publicise their results is the Internet. Others can use the information to complement their own studies. The rising tide of knowledge will become unchallengeable. This is the route that I have followed. Ever since I became involved in this climate change issue, way back in 1993, I reported that there is no evidence in the data to support the alarmist claims. The other side insisted that their computer models were infallible and that I was wrong. I did not try to prove that they were wrong. I just kept reiterating that there was no evidence in the data to support their theories. This was also my 93-page message to the Stern Review. You will recall their basic argument. Increasing undesirable greenhouse gas emissions result in rising global temperatures. These increase evaporation from the oceans. Energy is thereby transferred to the atmosphere. This in turn amplifies the greenhouse effect. All of this results in an intensification of the hydrological cycle: more extreme floods and droughts, etc etc. All of this results in threats to our precious plant and animal species and human life on this planet. (But as the analysis shows,) there is no evidence of changes in open water surface evaporation that are synchronous with global temperature changes during the period of record. This is a body blow for the climate alarmists. There is absolutely no evidence that global warming increases evaporation from open water surfaces, including the oceans.
If the alarmists try to follow the adaptation route, they will be squashed underfoot by civil engineers and applied hydrologists. There is only one remaining option. Abandon ship. In the meantime, you may find this item on the web interesting.
See Will’s latest memo here.