


By Joseph D’Aleo, CCM
A meteorologist friend has informed me of a comment he has posted on Climate Audit.
Since the beginning of the Mauna Loa data stream in 1958, no annual mean period has been observed with a CO2 concentration lower than the previous year although it came close in the mid 1960s. There is a chance that this record may be broken in this year or next. In just a few instances has the annual maximum in CO2 been lower than the prior max. Since we are just two months away from the normal annual maximum which is currently well below last year’s max (see here) this will likely be one of those exceptional years. None of the AGW crowd has yet suggested that man-made CO2 has declined or that the trend in land use vis-a-vis CO2 has reversed.
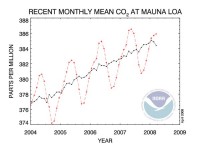
Black line represents seasonally adjusted values, red line the monthly observed values. See larger image here
I think that the anomalous decline in the slope of the Mauna Loa CO2 curve during this past boreal winter which is normally a season in which CO2 rises rapidly, is directly tied to the Central Pacific SST. Cooling SSTs raise the oceans’ solubility of CO2 which it then extracts from the atmosphere. In the 50-year history of the Mauna Loa record, the slope of the CO2 curve became more positive during the positive PDO regime, ~1975-2005, which favored warm Tropical SSTs (El Niños) with just a few brief La Ninas. PDO regimes usually last for about 30 years. Now that the PDO has shifted into a negative phase, we should see cooler La Nina patterns becoming more prevalent with fewer and briefer El Nino episodes. The 20th Century contained two positive PDO regimes and one negative one. Little wonder why there was a net rise in Globally averaged temperature during that period. Consistent on-site measurements of CO2 didn’t begin until the latter half of the last negative PDO. Furthermore, should CO2 concentrations at Mauna Loa now show a decline, it would suggest again that CO2 is a lagging indicator, not a leading one.
Skeptics continue to look for (and find) climate components that can be construed as falsifying the alarmist AGW hypotheses. Since the foundation of all of these hypotheses are a steady, if not accelerating, increase in man-made CO2, should we now see a year, just one year, in which total CO2 as observed at Mauna Loa shows a decline from the previous year(s) we may have found a smoking cannon.
[Some AGW proponents will say that the current cooling is not a result of CO2 but can be blamed on La Nina and should be ignored. That’s simple sophistry. La Nina is at least as much a component of the Global climate system as is CO2 and according to AGW alarmists, a CO2 driven warming should precede changes in SST, not follow it.]
Icecap Note: Another poster noted this is the second largest winter decline in the record trailing only 1971/72. Most years the rise from March to May is at least 1 ppm which would mean, we will see a higher max but a year-to-year increase much smaller than recent years.