By Dr. Don Easterbrook
1934 has long been considered the warmest year of the past century. A decade ago, the closest challenger appeared to be 1998, a super-el nino year, but it trailed 1934 by 0.54C (0.97F). Since then, NASA GISS has “adjusted” the U.S. data for 1934 downward and 1998 upward (see December 25, 2010 post by Ira Glickstein) in an attempt to make 1998 warmer than 1934 and seemingly erased the original rather large lead of 1934 over 1998.
The last phases of the strong 2009-2010 El Nino in early 2010 made this year another possible contender for the warmest year of the century. However, December 2010 has been one of the coldest Decembers in a century in many parts of the world, so 2010 probably won’t be warmer than 1998. But does it really matter?
Regardless of which year wins the temperature adjustment battle, how significant will that be? To answer that question, we need to look at a much longer time frame-centuries and millennia.
One of the best ways to look at long-term temperatures is with isotope data from the GISP2 Greenland ice core, from which temperatures for thousands of years can be determined. The ice core isotope data were obtained by Minze Stuiver and Peter Grootes from nuclear accelerator measurements of thousands of oxygen isotope ratios (16O/18O), which are a measure of paleo-temperatures at the time snow fell that was later converted to glacial ice. The age of such temperatures can be accurately measured from annual layers of accumulation of rock debris marking each summerís melting of ice and concentration of rock debris on the glacier.
The past century
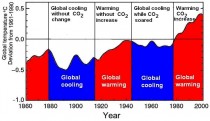
Two episodes of global warming and two episodes of global cooling occurred during the past century:

Figure 1. Two periods of global warming and two periods of global cooling since 1880. Enlarged here.
1880 to 1915 cool period. Atmospheric temperature measurements, glacier fluctuations, and oxygen isotope data from Greenland ice cores all record a cool period from about 1880 to about 1915. Many cold temperature records in North America were set during this period. Glaciers advanced, some nearly to terminal positions reached during the Little Ice Age about 400 years ago. During this period, global temperatures were about 0.9C (1.6F) cooler than at present. From 1880 to 1890, temperatures dropped 0.35C (0.6F) in only 10 years. The 1880-1915 cool period shows up well in the oxygen isotope curve of the Greenland Ice Sheet.
1915 to 1945 warm period
Global temperatures rose steadily in the 1920s, 1930s, and early 1940s. By the mid-1940s, global temperatures were about 0.5C (0.9F) warmer than they had been at the turn of the century. More high temperature records for the century were recorded in the 1930s than in any other decade of the 20th century. Glaciers during this warm period retreated, temperatures in the 1930s in Greenland were warmer than at present, and rates of warming were higher (warming 4C (7F) in two decades). All of this occurred before CO2 emissions began to soar after 1945, so at least half of the warming of the past century cannot have been caused by manmade CO2.
1945 to 1977 cool period
Global temperatures began to cool in the mid-1940’s at the point when CO2 emissions began to soar. Global temperatures in the Northern Hemisphere dropped about 0.5C (0.9F) from the mid-1940s until 1977 and temperatures globally cooled about 0.2C (0.4F). Many of the world’s glaciers advanced during this time and recovered a good deal of the ice lost during the 1915-1945 warm period. Many examples of glacial recession cited in the news media show contrasting terminal positions beginning with the maximum extent at the end of the 1880-1915 year cool period and ending with the minimum extent of the recent 20 year warm period (1977-1998). A much better gauge of the effect of climate on glaciers would be to compare glacier terminal positions between the ends of successive cool periods or the ends of successive warm periods.
1977 to 1998 global warming
The global cooling that prevailed from ~1945 to 1977 ended abruptly in 1977 when the Pacific Ocean shifted from its cool mode to its warm mode in a single year and global temperatures began to rise, initiating two decades of global warming. This sudden reversal of climate in 1977 has been called the
“Great Pacific Climate Shift” because it happened so abruptly. During this warm period, alpine glaciers retreated, Arctic sea ice diminished, melting of the Greenland Ice Sheet occur.
The abruptness of the shift in Pacific sea surface temperatures and corresponding change from global cooling to global warming in 1977 is highly significant and strongly suggests a cause-and-effect relationship. The rise of atmospheric CO2, which accelerated after 1945 shows no sudden change that could account for the “Great Pacific Climate Shift”.
1999 to 2010 global cooling
No global warming has occurred above the 1998 level and temperatures have declined slightly.
The past 500 years
Temperature oscillations recorded in Greenland ice cores over the past 500 years (Fig. 2) are truly remarkable. At least 40 periods of warming and cooling have occurred since 1480 AD, all well before CO2 emissions could have been a factor.

Figure 2. Warming and cooling periods from 1480 to 1960 AD. Enlarged here.
The past 5,000 years
Figure 3 shows oxygen isotope ratios from the GISP2 Greenland ice core for the past 5,000 years. Note that temperatures were significantly warmer than present from 1500 to 5000 years ago.

Figure 3. Oxygen isotope ratios for the past 5,000 years. Red areas are warm periods, blue areas are cool periods. Enlarged here.
The past 10,000 years
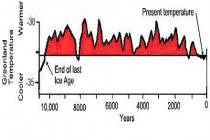
Most of the past 10,000 have been warmer than the present. Figure 4 shows temperatures from the GISP2 Greenland ice core. With the exception of a brief warm period about 8,200 years ago, the entire period from 1,500 to 10,500 years ago was significantly warmer than present.

Figure 4. Temperatures over the past 10,500 years recorded in the GISP2 Greenland ice core. (Modified from Cuffy and Clow, 1997)
Enlarged here.
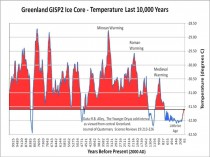
Another graph of temperatures from the Greenland ice core for the past 10,000 years is shown in Figure 5. It shows essentially the same temperatures as Cuffy and Clow (1997) but with somewhat greater detail. What both of these temperature curves show is that virtually all of the past 10,000 years has been warmer than the present.

Figure 5. Temperatures over the past 10,000 years recorded in the GISP2 Greenland ice core. Enlarged here.
So where do the 1934/1998/2010 warm years rank in the long-term list of warm years? Of the past 10,500 years, 9,100 were warmer than 1934/1998/2010. Thus, regardless of which year ( 1934, 1998, or 2010) turns out to be the warmest of the past century, that year will rank number 9,099 in the long-term list. The climate has been warming slowly since the Little Ice Age (Fig. 5), but it has quite a ways to go yet before reaching the temperature levels that persisted for nearly all of the past 10,500 years. It’s really much to do about nothing. PDF


