By CO2 Science
CO2 Science reviewed the paper “A 2000-year global temperature reconstruction based on non-treering proxies” by Loehle in 2007 Energy and Environment Volume 18, pages 1049-1058.
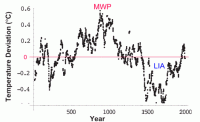
Using data from eighteen 2000-year-long proxy temperature series from all around the world that were not developed from tree-ring data (which provide significant interpretive challenges), the author (1) smoothed the data in each series with a 30-year running mean, (2) converted the results thereby obtained to anomalies by subtracting the mean of each series from each member of that series, and then (3) derived the final mean temperature anomaly history defined by the eighteen data sets by a simple averaging of the individual anomaly series, a procedure that he rightfully emphasizes is “transparent and simple.” The results obtained by this procedure are depicted in the figure below, where it can be seen, in the words of its creator, that “the mean series shows the Medieval Warm Period (MWP) and Little Ice Age (LIA) quite clearly, with the MWP being approximately 0.3C warmer than 20th century values.”

See larger image here
Loehle notes that “the 1995-year reconstruction shown here does not match the famous hockey stick shape,” which clearly suggests that one of them is a poorer, and the other a better, representation of the truth. Because of its simplicity and transparency, as well as a host of other reasons described in detail by Loehle—plus what we have learned since initiating our Medieval Warm Period Record-of-the Week feature—it is our belief that Loehle’s curve is by far the superior of the two in terms of the degree to which it likely approximates the truth. Get printable version of this review here.


