By N.F. Glasser and T.A. Scambos
Global warming may not be entirely to blame for the collapse of an Antarctic ice shelf in 2002, according to research published today. The 10,000-year-old Larsen B ice shelf was initially believed to be a victim of climate change. But a paper published in the Journal of Glaciology claims the shelf had been teetering on collapse for decades. Professor Neil Glasser, of Aberystwyth University, the paper’s lead author, said cracks and fault lines in the ice had significantly weakened the structure. “A number of other atmospheric, oceanic and glaciological factors are involved. For example, the location and spacing of fractures on the ice shelf such as crevasses and rifts are very important too because they determine how strong or weak the ice shelf is.”
From their abstract: We define domains on the ice shelf related to glacier source areas and demonstrate that, prior to collapse, the central Larsen B ice shelf consisted of four sutured flow units fed by Crane, Jorum, Punchbowl and Hektoria/Green/Evans glaciers. Between these flow units were ‘suture zones’ of thinner ice where the feeder glaciers merged. Prior to collapse, large open-rift systems were present offshore of Foyn Point and Cape Disappointment. These rifts became more pronounced in the years preceding break-up, and ice blocks in the rifts rotated because of the strong lateral shear in this zone. We suggest that the ice shelf was preconditioned to collapse by partial rupturing of the sutures between flow units. See full paper here.
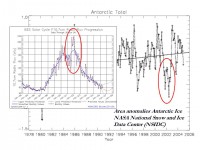
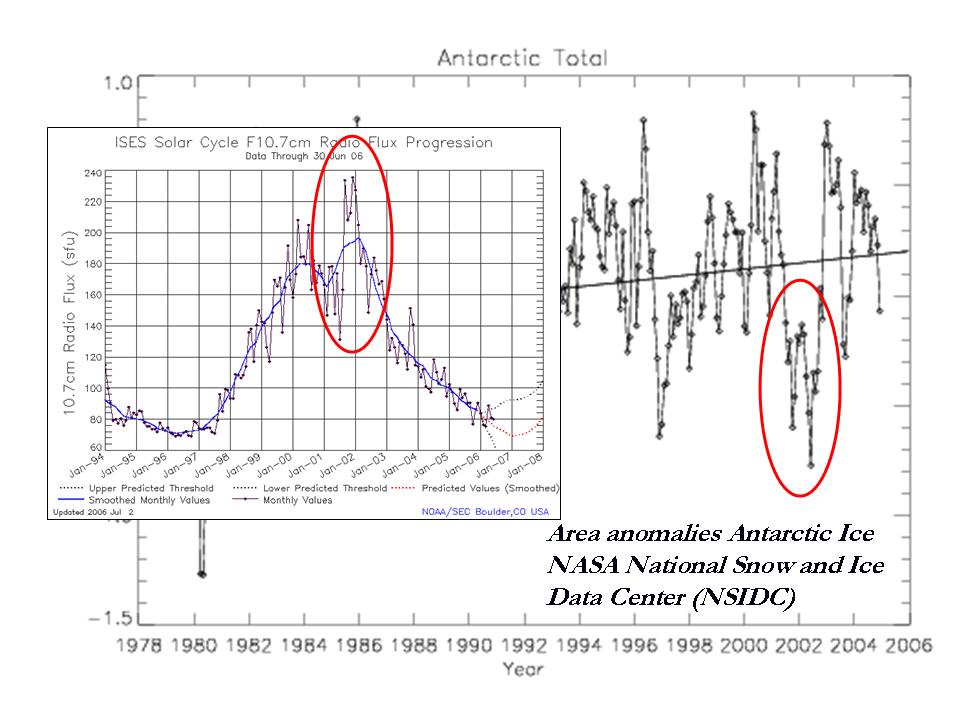
Icecap Note: The breakdown in 2002 as the authors showed may have had its seeds in antecedent conditions which affected the ice-shelf’s structure and stability. A factor that may be pertinent to the timing of that break-up was the high solar flux, second solar cycle max that occurred from September 2001 to April 2002. Notice in the image below the coincident timing of the high flux and ice decline.
See full size image here.
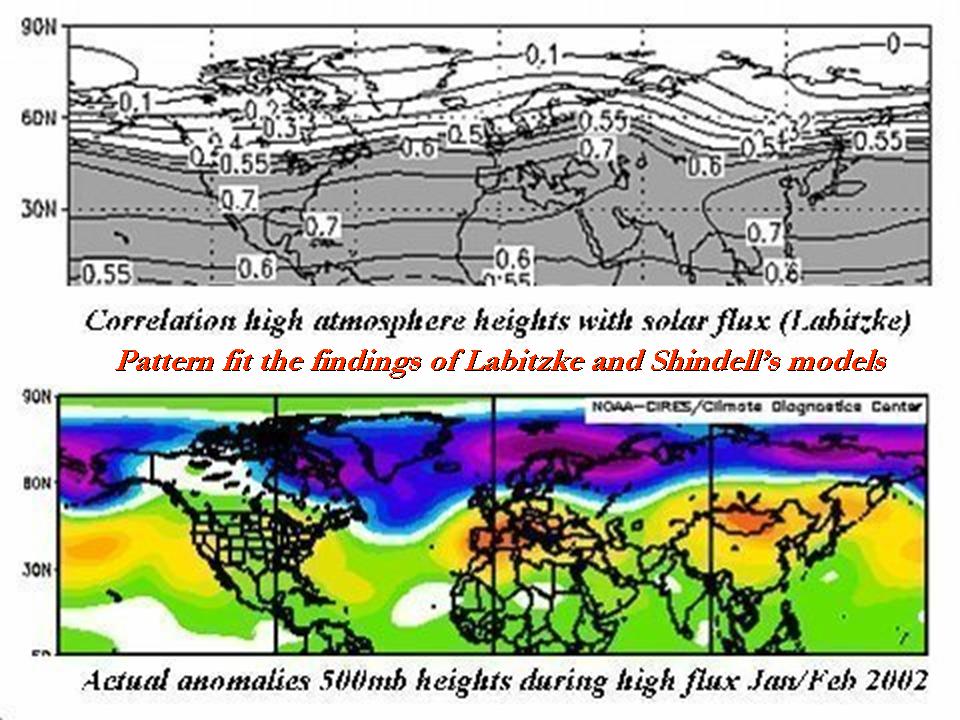
In work done by Shindell et al. at NASA GISS, they showed how high solar flux which usually means high ultraviolet leads to heating due to ozone chemistry in the high atmosphere in low and middle latitudes. That heat makes its way down with time into the troposphere in the models. This supported the work of Labitzke who found diffferences from solar minimum to solar maximum that she related to the 6-8% changes in ultraviolet radiation during the cycle. She also found empirical evidence the warming extends from the stratosphere down into the troposphere.
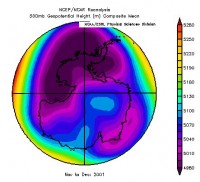
In 2001/02, this warming was observed in low and middle latitudes causing heights to rise and the polar vortexes in both hemisphere to shrink. It was a warm ‘zonal’ winter in the Northern Hemishere. In the southern hemisphere, the vortex split into two in November/December, it was reported for the first time in recorded history. The changing winds and currents MAY have helped trigger the break-up. You can see the average 500 mb heights during November and December showing a split in the southern vortex which may have started the changes in low levels that broke up the “teetering” ice shelf. The ice quickly reformed by the following winter.