


Joseph D’Aleo here
Introduction
Virtually every month and year we see reports that proclaim the global data among the warmest in the entire record back to 1895 or earlier. But the efforts to assess changes to the climate are very young and beset with many issues.
The first truly global effort to measure atmospheric temperatures began with the help of satellite infrared sensing in 1979.
The first U.S. station based data set and monthly analysis was launched in the late 1980s and for the global in 1992. These datasets are products of simulation models and data assimilation software, not solely real data.
One of the key issues is Spatial Bias - the density of observation stations varied greatly on the global scale. Dr. Mototaka Nakamura in his book “Confessions of a climate scientist: the global warming hypothesis is an unproven hypothesis” writes that over the last 100 years “only 5 percent of the Earth’s area is able show the mean surface temperature with any certain degree of confidence. “A far more serious issue with calculating ‘the global mean surface temperature trend’ is the acute spatial bias in the observation stations. There is nothing they can do about this either. No matter what they do with the simulation models and data assimilation programs, this spatial bias before 1980 cannot be dealt with in any meaningful way.”
On top of this spatial bias:
* Missing monthly data from existing stations for 20-90% of the stations globally requiring model infilling, sometimes using data from stations hundreds of miles away
* Station siting not to specifications (US GAO found 42% U.S. stations needed to remedy siting) with serious warm biases
* Airport sensor systems were designed for aviation and not climate allowing temperature errors up to 1.9F
* Adjustments to early record occur with every new update, each cooling early data in the record, causing more apparent warming.Dr. Nakamura blasts the ongoing data adjustments: “Furthermore, more recently, experts have added new adjustments which have the helpful effect of making the Earth seem to continue warming”. He deems this “data falsification”.
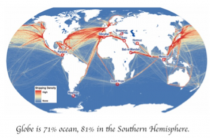
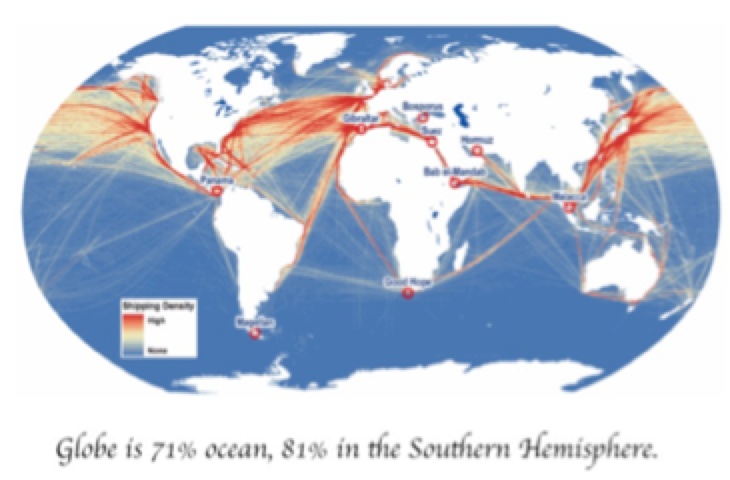
* Oceans which cover 71% of the globe (81% of the Southern Hemisphere) had data limited to shipping lanes, mainly in the northern hemisphere until 50km nighttime satellite ocean skin temperatures measurement became available after 1984 and the ARGO 4000 buoy global network after 2000.
Attempting to compile a ‘global mean temperature’ from ever changing, fragmentary, disorganized, error-ridden, geographically unbalanced data with multi-decadal evidence of manipulation does not reach the level of the IQA quality science required for the best possible policy decision making. We went from recognizing the serious observation limitations into the late 20th century to making claims we can state with confidence how we rank each month for the US and globe to tenths of a degree back into the 1800s.
Dr. Nakamura commented at NTZ: “So how can we be sure about the globe’s temperatures, and thus it’s trends before 1980? You can’t. The real data just aren’t there.Therefore, the global surface mean temperature change data no longer have any scientific value and are nothing except a propaganda tool to the public.”
The most prudent step to take for our nation would focus on satellite data and CRN and USRCRN, if funded, for land and ARGO buoy data for the oceans and assess the changes over the next few decades before taking radical steps to cancel our country’s hard fought and finally achieved energy independence
Temperature Measurement Timeline Highlights
We hear every month and year claims about record setting warmth back into the 1800s. But see below how recently we attempted to reconstruct the past - scraping together segments of data and using models and adjustments to create the big picture. This was especially difficult over the oceans which cover 71% of the earth’s surface.
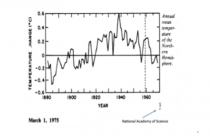
1975 - National Academy of Science makes first attempt at determining global temperatures and trend, which they limited to the Northern Hemisphere land areas (U.S. and Europe). This was because they recognized reliable date on a larger scale and over the ocean was just not available or trustworthy. The data they were able to access showed a dramatic warming from the 1800s to around 1940 then a reversal ending to the late 1970s roughly eliminating the nearly 60 years of warming. The CIA warned that the consensus of scientists was we might be heading towards a dangerous new ice age.
1978 - New York Times reported there was too little temperature data from the Southern Hemisphere to draw any reliable conclusions. The report they references was prepared by German, Japanese and American specialists, and appeared in the December 15 issue of Nature, the British journal. It stated that “Data from the Southern Hemisphere, particularly south of latitude 30 south, are so meager that reliable conclusions are not possible,” the report says. “Ships travel on well-established routes so that vast areas of ocean, are simply not traversed by ships at all, and even those that do, may not return weather data on route.”
1979 - Global satellite temperature measurement of the global atmosphere begins at UAH and RSS.
1981 - NASA’s James Hansen et al reported that “Problems in obtaining a global temperature history are due to the uneven station distribution, with the Southern Hemisphere and ocean areas poorly represented” (Science, 28 August 1981, Volume 213, Number 4511(link))
1989 - At that time, in response to the need for an accurate, unbiased, modern historical climate record for the United States, personnel at the Global Change Research Program of the U.S. Department of Energy and at NCEI defined a network of 1219 stations in the contiguous United States whose observation would comprise a key baseline dataset for monitoring U.S. climate. Since then, the USHCN (U.S. Historical Climatology Network) dataset has been revised several times (e.g., Karl et al., 1990; Easterling et al., 1996; Menne et al. 2009). The three dataset releases described in Quinlan et al. 1987, Karl et al., 1990 and Easterling et al., 1996 are now referred to as the USHCN version 1 datasets.
The documented changes that were addressed include changes the time of observation (Karl et al. 1986), station moves, and instrument changes (Karl and Williams, 1987; Quayle et al., 1991). Apparent urbanization effects were also addressed in version 1 with a urban bias correction (Karl et al. 1988)
Tom Karl wrote with Kukla and Gavin in a 1986 paper on Urban Warming: “MeteoSecular trends of surface air temperature computed predominantly from [urban] station data are likely to have a serious warm bias...The average difference between trends [urban siting vs. rural] amounts to an annual warming rate of 0.34C/decade (3.4C/century)… The reason why the warming rate is considerably higher [may be] that the rate may have increased after the 1950s, commensurate with the large recent growth in and around airports. Our results and those of others show that the urban growth inhomogeneity is serious and must be taken into account when assessing the reliability of temperature records.”
Here was an early 1989 plot of USHCNv1.
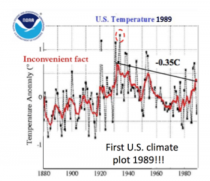
Enlarged
1989 - The NY Times reported the US Data “failed to show warming trend predicted by Hansen in 1980.”
1992 - NOAA’s first global monthly assessment began (GHCNm - Vose). Subsequent releases include version 2 in 1997(Peterson and Vose, 1997), version 3 in 2011 (Lawrimore et al. 2011) and, most recently, version 4 (Menne et al. 2018). For the moment, GHCNm v4 consists of mean monthly temperature data only.
1992 - The National Weather Service (NWS) Automated Surface Observing System (ASOS), which serves as the primary data source for more than 900 airports nationwide and is utilized for climate data archiving was deployed in the early 1990’s. Note the criteria specified a Root-mean-square-error (RMSE) of 0.8F and max error of 1.9F. ASOS was designed to supply key information for aviation such as ceiling visibility, wind, indications of thunder and icing. They were NOT designed for assessing climate.
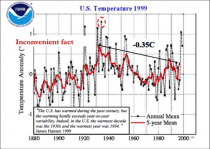
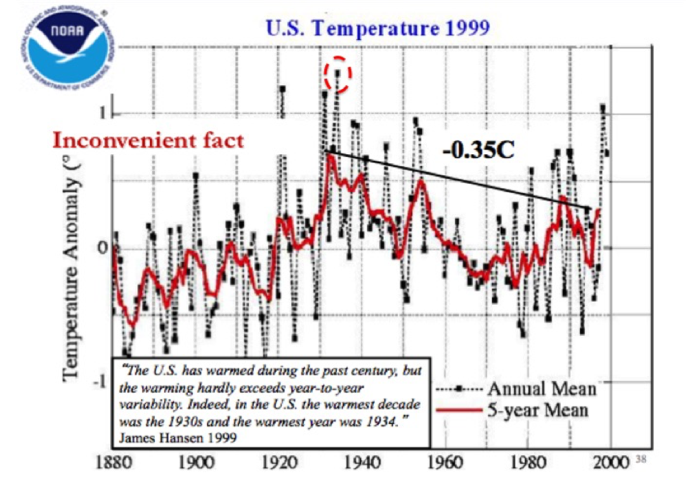
1999 - The USHCN temperature still trailed 1934 as it had a decade earlier - James Hansen noted “The U.S. has warmed during the past century, but the warming hardly exceeds year-to-year variability. Indeed, in the U.S. the warmest decade was the 1930s and the warmest year 1934.” When asked why the discrepancy, Hansen said the US was only 2% of the world and both could be right.
Here was the 1999 plot.
2000 - A network of nearly 4000 diving buoys (ARGO) were deployed world wide to provide the first reliable real-time, high resolution monitoring of ocean temperatures and heat content.
2004 - National Climate Reference Network was launched with guidance from John Christy of UAH who had a pilot network in Alabama where he was State Climatologist to provide uncontaminated temperatures in the lower 48 states. The 114 stations met the specifications that kept them away from local heat sources.
2005 - Pielke and Davey (2005) found a majority of stations, including climate stations in eastern Colorado, did not meet requirements for proper siting. They extensively documented poor siting and land-use change issues in numerous peer-reviewed papers, many summarized in the landmark paper “Unresolved issues with the assessment of multi-decadal global land surface temperature trends” (2007).
2007 - A new version of the U.S. climate network, USHCNv2 had adjustments including Karl’s adjustment for urban warming’. David Easterling, Chief Scientific Services Division for NOAA’s Climate Center expressed concern in a letter to James Hansen at NASA “One fly in the ointment, we have a new adjustment scheme for USHCNv2 that appears to adjust out some, if not all of the local trend that includes land use change and urban warming”.
2008 - In a volunteer survey project, Anthony Watts and his more than 650 volunteers at http://www.surfacestations.org found that over 900 of the first 1,067 stations surveyed in the 1,221 station U.S. climate network did not come close to the specifications as employed in Climate Reference Network (CRN) criteria. Only about 3% met the ideal specification for siting. They found stations located next to the exhaust fans of air conditioning units, surrounded by asphalt parking lots and roads, on blistering-hot rooftops, and near sidewalks and buildings that absorb and radiate heat. They found 68 stations located at wastewater treatment plants, where the process of waste digestion causes temperatures to be higher than in surrounding areas. In fact, they found that 90% of the stations fail to meet the National Weather Service’s own siting requirements that stations must be 30 m (about 100 feet) or more away from an artificial heating or reflecting source.
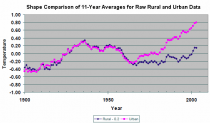
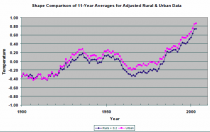
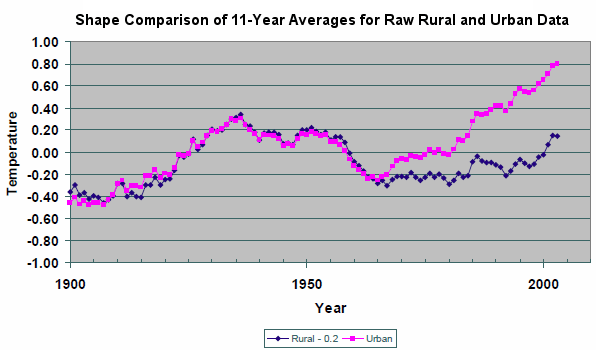
2009 - NASA’s Dr. Edward R. Long in a 2009 analysis looked at the new version of the US data. Both raw and adjusted data from the NCDC (now NCEI) was examined for a selected Contiguous U.S. set of rural and urban stations, 48 each or one per State. The raw data provides 0.13 and 0.79 C/century temperature increase for the rural and urban environments, consistent with urban factors. The adjusted data provides 0.64 and 0.77 C/century respectively.
Comparison of the adjusted data for the rural set to that of the raw data shows a systematic treatment that causes the rural adjusted set’s temperature rate of increase to be 5-fold more than that of the raw data. This suggests the consequence of the NCDC’s protocol for adjusting the data is to cause historical data to take on the time-line characteristics of urban data. The consequence intended or not, is to report a false rate of temperature increase for the Contiguous U. S., consistent with modeling utilizing the Greenhouse theory.
2010 - A 2009 review of temperature issues was published by a large group of climate scientists entitled Surface Temperature Records: A Policy Driven Deception .
2010 - A landmark study Analysis of the impacts of station exposure on the U.S. Historical Climatology Network temperatures and temperature trends followed, authored by Souleymane Fall, Anthony Watts, John Nielsen-Gammon, Evan Jones, Dev Niyogi, John R. Christy, Roger A. Pielke Sr represented years of work in studying the quality of the temperature measurement system of the United States.
2010 - In a review sparked by this finding, the GAO found “42% of the active USHCN stations in 2010 clearly did not meet NOAA’s minimum siting standards. Whatsmore, just 24 of the 1,218 stations (about 2 percent) have complete data from the time they were established.”
2011 - A paper ”A Critical Look at Surface Temperature Records” was published in Elsevier’s “Evidence-Based Climate Science”.
2013 - NOAA responded to papers on siting and GAO admonition by removing and/or replacing the worst stations. Also in monthly press releases no satellite measurements are ever mentioned, although NOAA claimed that was the future of observations.
2013 - Richard Muller releases The Berkeley Earth Surface Temperatures (BEST) set of data products, originally a gridded reconstruction of land surface air temperature records spanning 1701-present, and including an 1850-present merged land-ocean data set that combines the land analysis with an interpolated version of HadSST3. Homogenization is heavily used and seasonal biases prior to Stevenson Screens in the early record are acknowledged.
2015 - A pause in warming that started around 1997 was finally acknowledged in the journal Nature by IPCC Lead Author Kevin Trenberth and attributed to cyclical influences of natural factors like El Nino, ocean cycles on global climate. The AMS Annual Meeting in 2015 had 3 panels to address ‘the pause’.
2016 - The study of Tom Karl et al. 2015 purporting to show no ‘hiatus’ in global warming in the 2000s (Federal scientists say there never was any global warming “pause"). John Bates who spent the last 14 years of his career at NOAA’s National Climatic Data Center as a Principal Scientist commented “in every aspect of the preparation and release of the datasets leading into Karl 15, we find Tom Karl’s thumb on the scale pushing for, and often insisting on, decisions that maximize warming and minimize documentation. The study drew criticism from other climate scientists, who disagreed with Karl’s conclusion about the ‘hiatus.’
2017 - A new U.S. climate data set nClimDiv with climate division model reconstructions and statewide averages was gradually deployed and replaced USHCNv2. The result was NOAA gave 40 out of 48 states ‘new’ warming. The Drd964x decadal CONUS warming rate from 1895 to 2012 was 0.088F/decade. The new nClimDiv rate from 1895 to 2014 is 0.135F/decade, almost double. Though it makes the job of analysts and data access more flexible it was at the expense of accuracy as demanded by the IQA.
2017 - Landmark studies were published which proved conclusively that the steadily rising Atmospheric CO2 Concentrations had no statistically significant impact on any of the 14 temperature time series (at the surface and in the atmosphere) and showed the so called greenhouse induced Tropical Hot Spot caused by rising atmospheric CO2 levels, simply does not exist in the real world.
2019 - Climate Scientist Dr. Mototaka Nakamura in his book “Confessions of a climate scientist: the global warming hypothesis is an unproven hypothesis” writes that over the last 100 years “only 5 percent of the Earth’s area is able show the mean surface temperature with any certain degree of confidence. “A far more serious issue with calculating ‘the global mean surface temperature trend is the acute spatial bias in the observation stations. There is nothing they can do about this either. No matter what they do with the simulation models and data assimilation programs, this spatial bias before 1980 cannot be dealt with in any meaningful way.” “So how can we be sure about the globe’s temperatures, and thus it’s trends before 1980? You can’t. The real data just aren’t there. Therefore, the global surface mean temperature change data no longer have any scientific value and are nothing except a propaganda tool to the public.”
2020 - The U.S. Regional Climate Reference Network (USRCRN) pilot program (2011) had goals to maintain the same level of climate science quality measurements as the national-scale U.S. Climate Reference Network (USCRN), but its stations would be spaced more closely and focus solely on temperature and precipitation. After a pilot project in the Southwest, USRCRN stations were to be deployed at a 130 km spatial resolution across the United States to provide for the detection of regional climate change signals. If NOAA had advanced this, America would for the first time ever have a data set that could be relied on for policy making after a few decades. Even then, the new data will not replace the old data with all its issues and uncertainties, which are not appropriate for policy decisions. It appears this program will not be advanced under this administration.
2020 - Taishi Sugiyama of Japan’s The Canon Institute for Global Studies working paper on our climate system: The Earth Climate System as Coupled Nonlinear Oscillators under Quasi-Periodical Forcing from the Space (this includes ENSO and solar). We could not agree more. See peer reviewed comments on these natural factors here.