


By Matt Vooro
The AMO is an ongoing series of long-duration changes in the sea surface temperature of the North Atlantic Ocean, with cool and warm phases that may last for 20-40 years at a time and a difference of about 1F between extremes. These changes are natural and have been occurring for at least the last 1,000 years. [per NOAA].
The AMO index is calculated at NOAAPSD by using the Kaplan SST data set [5x5], determining the area weighted average over the North Atlantic over 0-70N and then detrending this data. The average AMO index or the Atlantic Multidecadal Oscillation index went negative or cool in January 2009 The average for the first 5 months this year is about [-0.06] . It has been cooling since 2003. In the past, the very cold seasons of North America and especially the East coast happened when the annual average AMO went cool [ as low as -0.405] in the 1970’s.
It seems that this level of cool AMO may be several years off as the AMO cooling rate appears to be still slow. Back in 1964 it took about 8 years before the AMO went to [-0.3] by 1971. Review of other periods for similar rates of decline of the AMO show a spread of about 2-8 years. However the solar activity was much higher during 1964-1972 and things may cool down faster currently with extended solar minimum and anticipated low future solar cycles. If AMO does drop faster, then the cold weather like 1964-1979 may be the norm here much sooner and the East Coast will cool down as well as will the globe. The most sustained number of low AMO levels was during the cold spell of 1902 -1925 and again the 1970’s.
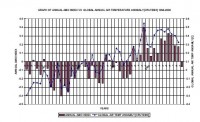
The graph below shows how closely Annual Global Air Temperature Anomalies [Crutem3] follow the Atlantic Multidecadal Oscillation Index [AMO] below and enlarged here.
The last interval change was 1994 or about 15 years ago and according to Enfeld et.al (2005), the probability that AMO will switch to cool in 15 years is about 80%. Based on this analysis , there is a high probability that the current cooling phase of AMO which started in 2009 is real and likely sustainable for the next 20 years at least.
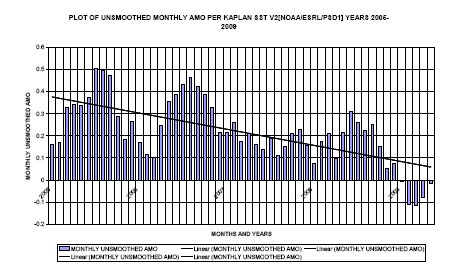
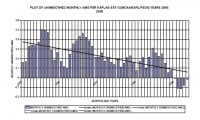
The graph below shows the decline of the AMO index from warm to cool between 2005 and 2009 below and enlarged here.
EL NINO 2009-2010
There has been an El Nino within about 12 months after each of the last four solar minimums. The same pattern seems to be developing again now. The El Nino may be a moderate or weak and short lived [about a year]. It may have a minor effect on global temperatures, like in the period 1965-1966 when US temperatures continued to drop despite the El Nino.
AMO appears to be like a thermostat or predictor of global temperatures. ENSO events if moderate or strong seem to modify, amplify or over-ride the AMO effects. This pattern will continue to bring cool yearly temperatures and colder and snowy winters like 2008 and 2009. My best guess is that the climate of the 1960’and 1970’s will be our climate for the next several decades [2-3] at least, and inter-dispersed with periodic warm years. PDO and AMO readings are of limited value for short term use but quite useful and accurate for decadal forecasts. Currently 2009 looks something like 1971 [cool PDO, low cool/ near neutral AMO] and the rest of this decade looks like the 1970’s if you had pick one decade from the past. The 1960’s and the 1950 are also close behind.
This latest period of cooler weather is not the start of some modern ice age or new grand cold minimum but just another cool cycle of the planet that happens about after every 20-30 years more recently when AMO and PDO are both in the cool mode simultaneously. The coldest last such cycle 1902-1925 when AMO hit a single month low of -0.563 and PDO went down to -1.72 and global air temperature anomalies plummeted to -0.581C [crutem3] in 1911. Other such cool periods occurred 1964-1976 and also much earlier during the Dalton and Maunder Minimums. Read more here.
Icecap notes: See Matt’s earlier post here. See a 2008 post by Dr. Don Easterbrook on the PDO and NAO influences on a cooling climate here.
See also my recent Intellicast post “ El Ninos in a Cold PDO - Are they Different?”. See another older post “Taking a Time Machine Ride Back to the 1960s or 1800s?”. See also a story on the AMO here and PDO here. Another upcoming story will support Matt’s view on this upcoming El Nino. See an older Icecap post on the role of the oceans in climate here.
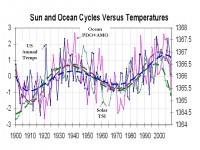
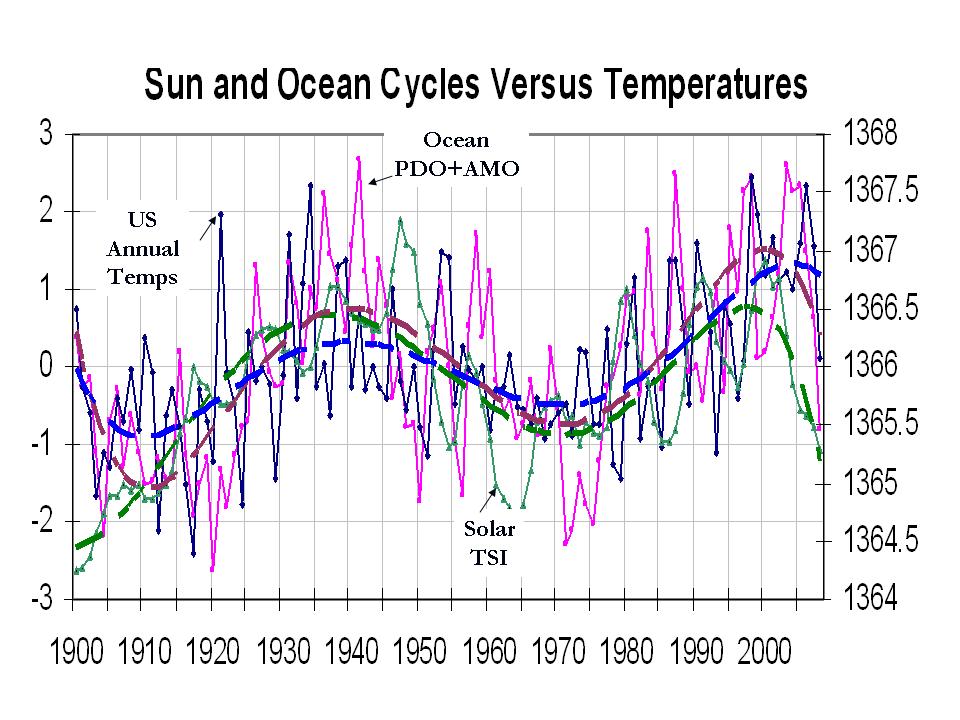
See how well the annual US temperatures (USHCNv2) correlates with both the oceans (PDO + AMO) and sun (Hoyt Schatten Willson Total Solar Irradiance or TSI calibrated to ACRIM). Enlarged here.
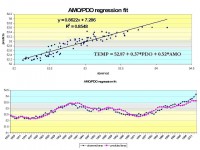
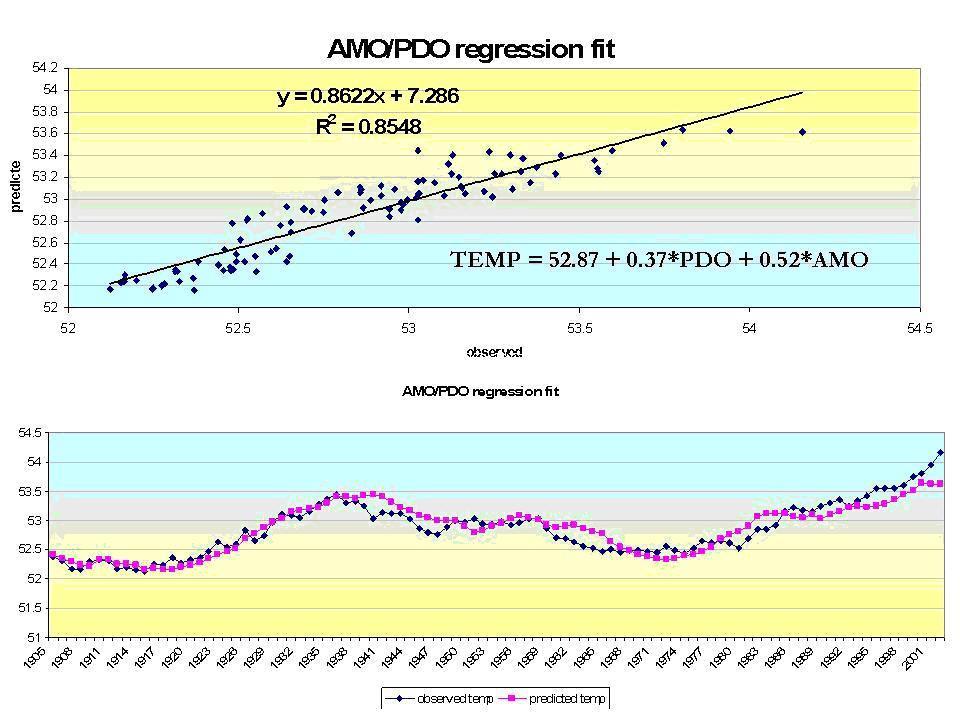
See larger version here of a simple multiple regression model using smoothed (11 point) PDO and AMO and USHCN v2 temperatures (r-squared 0.85).