


Alarmists and the media like to tell us the arctic warming is unprecedented and can only be explained by greenhouse gas theory. We have posted stories on the site like this one and one with Joe D’Aleo and George Taylor in About Climate Change arguing the multidecadal cycles in the ocean possibly related to solar are the real drivers with much better correlations. This following post is excellent.
Global Warming Science
NASA’s James Hansen (Hansen et al 2007 “Climate simulations for 1880–2003 with GISS modelE” Clim Dyn (2007) 29:661–696 [PDF ]observed that the climate model was not correctly simulating the 1930s-1940s warm period in the global average temperature: “It may be fruitless to search for an external forcing to produce peak warmth around 1940. It is shown below that the observed maximum is due almost entirely to temporary warmth in the Arctic. Such Arctic warmth could be a natural oscillation (Johannessen et al. 2004), possibly unforced. Indeed, there are few forcings that would yield warmth largely confined to the Arctic. Candidates might be soot blown to the Arctic from industrial activity at the outset of World War II, or solar forcing of the Arctic Oscillation (Shindell et al. 1999; Tourpali et al. 2005) that is not captured by our present model. Perhaps a more likely scenario is an unforced ocean dynamical fluctuation with heat transport to the Arctic and positive feedbacks from reduced sea ice.”
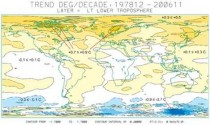
So Hansen asserts that the previous warming cycle was natural (perhaps “solar forcing of the Arctic Oscillation"), but the current warming cycle is due to CO2. And yet the current “global” warming has also been “largely confined to the Arctic”.
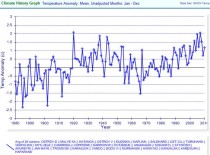
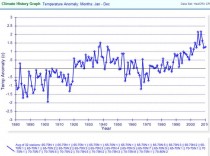
The following figures compare the annual average temperature anomaly data for the Arctic for NOAA GHCN (unadjusted) and Hadley CRUTEM3 (adjusted and averaged over 5x5 degree grids) through 2010. All stations or grids north of 65N with data extending from before 1930 to after 2000 have been included. (Plotted )
GHCN - 29 stations
Hadley Arctic stations
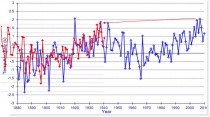
The following figure compares the above two figures with GHCN in blue and CRUTEM3 in red. Hadley/CRU adjustments result in reduction in past warm years in the 1920s-1940s and slightly warmer temperatures in the mid-2000s.
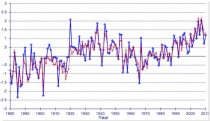
The following figure shows the GHCN temperature anomaly data (blue) along with the same data shifted back 69 years and down 0.3 degrees (red).
This shows the similarity of the cycles and may portend 25 years of cooling before the warming resumes.
The following figure shows the AMO+PDO superimposed on the Arctic average annual temperature shown at the beginning of this document.
Read much more on the reason for the cycle in this story and on the Icecap links above.