


Note: The CATO Institute is sponsoring the Green Swindle here. Well worth your time.
C3
Since the late 1980’s, global warming alarmists have been blaring ad nauseum that the world is suffering from ever higher temperatures, setting new hot temperature records, supposedly on a constant basis. Whenever warm weather arrives in the Northern Hemisphere, the warming hype onslaught from government paid climate scientists, MSM journalists and Hollywood celebrities escalates, as seemingly every new day, new week, new month, new quarter, new year and etc. is pronounced as the warmest evaaar! But is the world truly experiencing these highly publicized extreme, unprecedented hot temperatures?
The simple and honest answer is an emphatic ‘NO!’. In a previous post, the actual temperature data from weather stations around the world showed that “global” warming is actually regional warming, and, my goodness, also regional cooling. And if human CO2 emissions were really causing unprecedented, hot global weather (temperatures) then new hot temperature records for each continent should be happening - it ain’t happening, though, folks.
Looking at the map below (map source enlarged), the hottest and coldest temperatures ever recorded in modern times are presented for each continent.
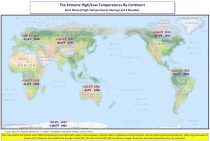
Look closely and realize what has actually not taken place. The last ‘hottest’ temperature record was set way back in 1977. Per the calendar, some 33 years later, no continent has exceeded their previous hot temperature record - and some of those records go all the way back to the early 20th century.
Hey...the next time you hear or read “unprecedented temperatures” from a ignorant leftist/liberal elite, don’t cut them any slack, go ahead and snicker (or start giggling) - it’s alright, you’re allowed to laugh at the stupendous ignorance exhibited by the Gore-zombies of the “progressive” left.
Remember, the myth that Earth “has a fever,” and the myth that human CO2 causes extreme temperatures, and the myth that unprecedented warming is global, are just that: myths, spread by individuals with a variety of crazy-leftist agendas.
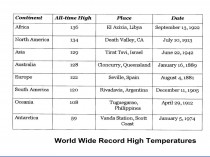
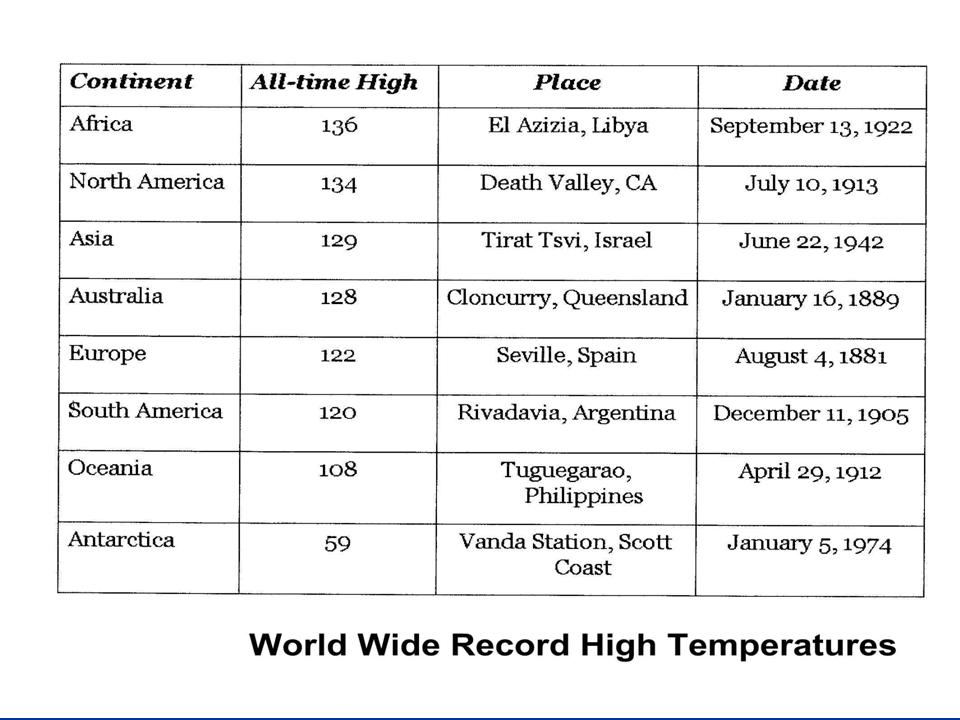
For map (click here to enlarge). See table form below (source NOAA NCDC).
Enlarged here.
Did we say “extreme?” A few more Wikipedia extreme temperature/weather trivia points of relevance: (1) Fastest temperature rise recorded - 49F in 2 minutes in 1942; (2) Fastest temperature drop recorded - 47F in 15 minutes in 1911; (3) Most consecutive days above 100F recorded - 160 days from 1923 to 1924. And by the way, each of these most extreme weather events took place well before the influence of large human CO2 emissions.
Additional current temp charts here. Historical temp charts here. Excellent compilations!
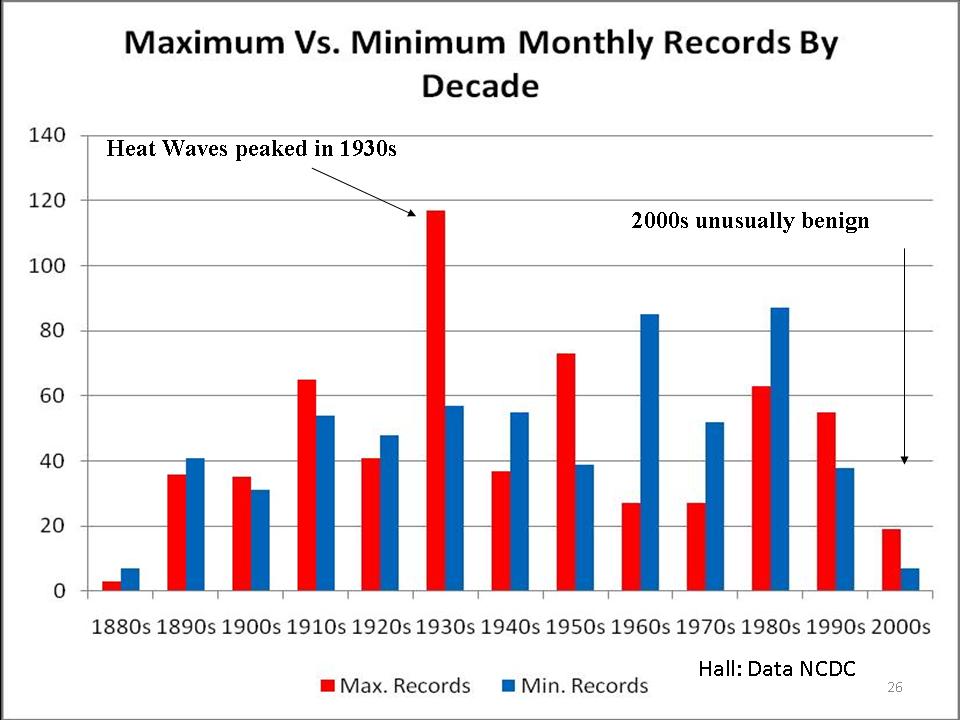
See US state heat records (50 states - 12 months) below enlarged here (source Bruce Hall compiled from NCDC)

----------------------
CRU, NOAA AND NASA DATA MANIPULATION
By Joseph D’Aleo, CCM
Phil Jones admitted to the BBC that there was no statistically significant warming since 1995 and that it had cooled globally 0.12C from 2002 to 2009, not statistically significant but nonetheless a cooling even asw CO2 continued to rise. Temperatures popped this year as a strong though relatively brief El Nino came on. Even with El Nino, it was a brutally and in places all-time record cold winter in many land areas of the Northern Hemisphere last winter, but the Pacific thanks to the warm El Nino and the Atlantic thanks to a lack of tropical activity the prior summer and less wind and clouds with a weakened and suppressed subtropical high and high latitude blocking high pressure were both unseasonably warm. Land areas felt some of that warmth this summer though La Nina cooled the Pacific dramatically.
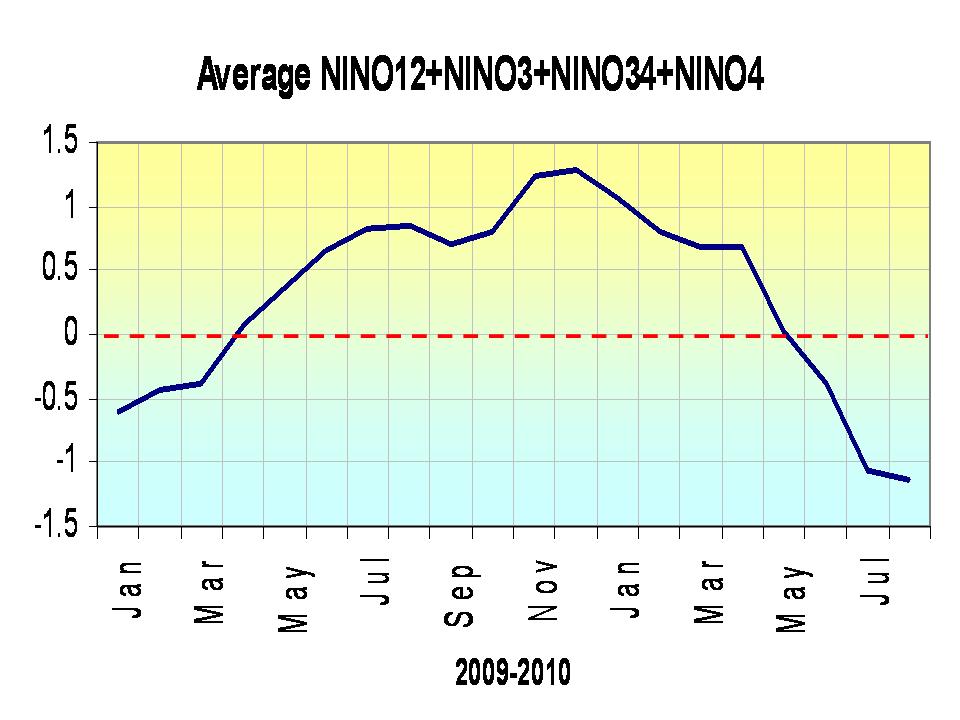
Average NINO region temperatures since January 2009 (enlarged here).
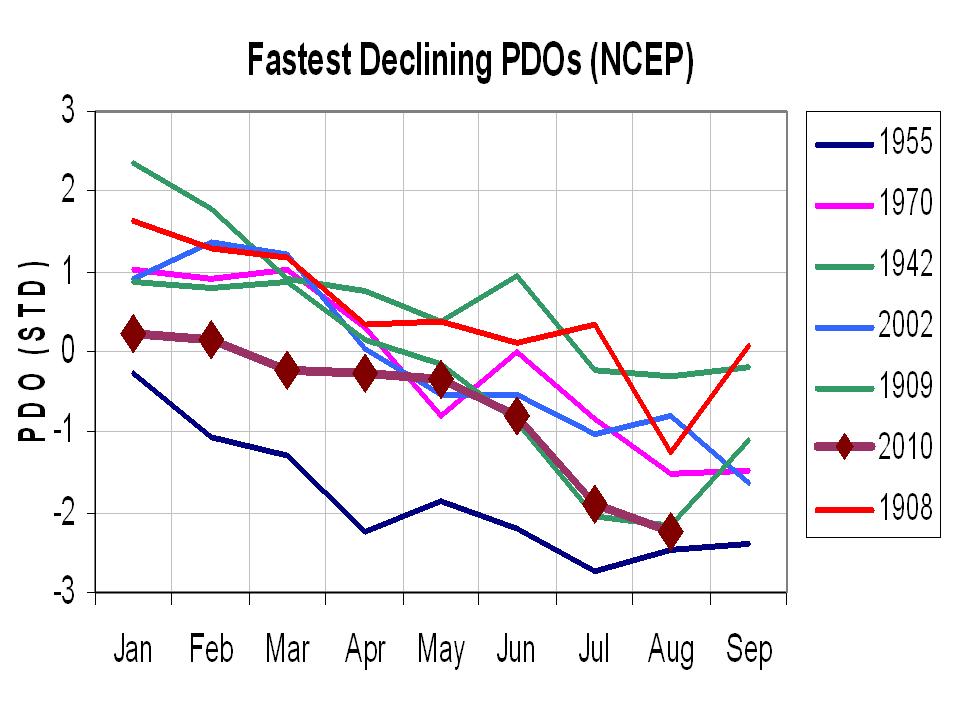
The PDO was slightly positive with the strong El Nino this January but is now strongly negative. This is a plot of all years in which the Multivariate ENSO Index (MEI) declined more than 2 STD from January to August. Enlarged here. This should induce a global cooling in upcoming months. This will be aided by a cooling of the Atlantic by the tropical activity which is enhanced by La Nina and acts to extract excess tropical heat from the tropical oceans and reduce warm anomalies further north through mixing.
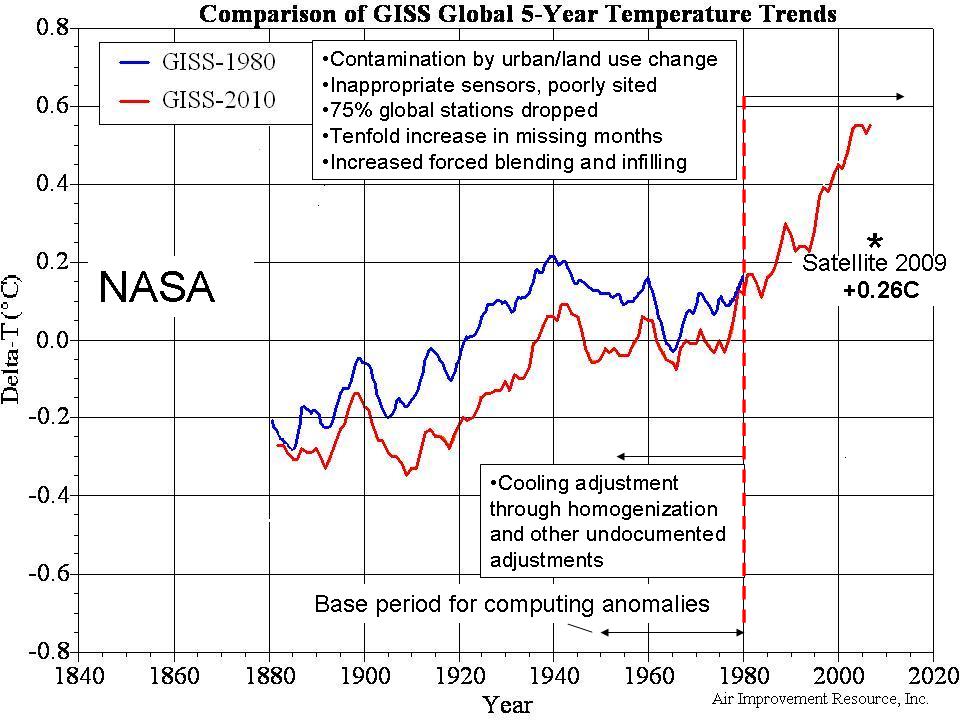
Nevertheless the manipulation of the global data bases in all the data sets over the last century has elevated the chances that each month will rank among the warmest. All three data centers have cooled the past and warmed the more recent years through their data manipulation. Here are NASA plots of 1980 and 2010.
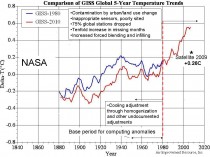
Enlarged here.
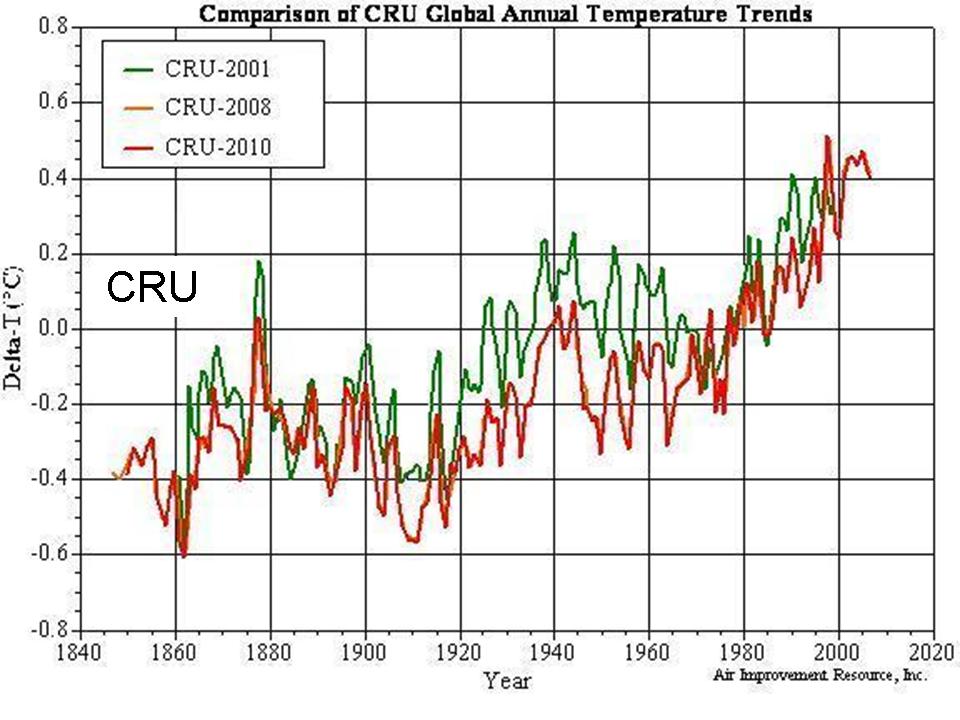
Here is the CRU plot just since 2001.
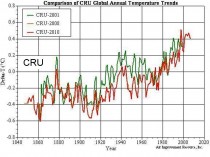
Enlarged here.
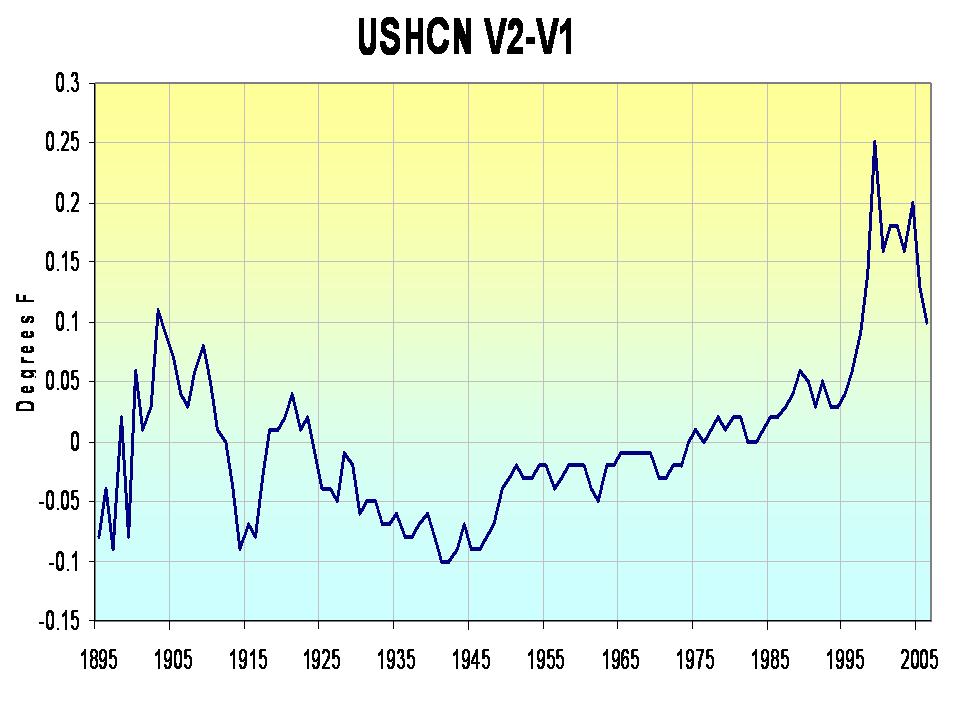
This is the change in the NOAA USHCN in 2007 from the original version in 1990.
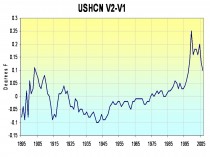
Enlarged here. More on NOAA coming soon.
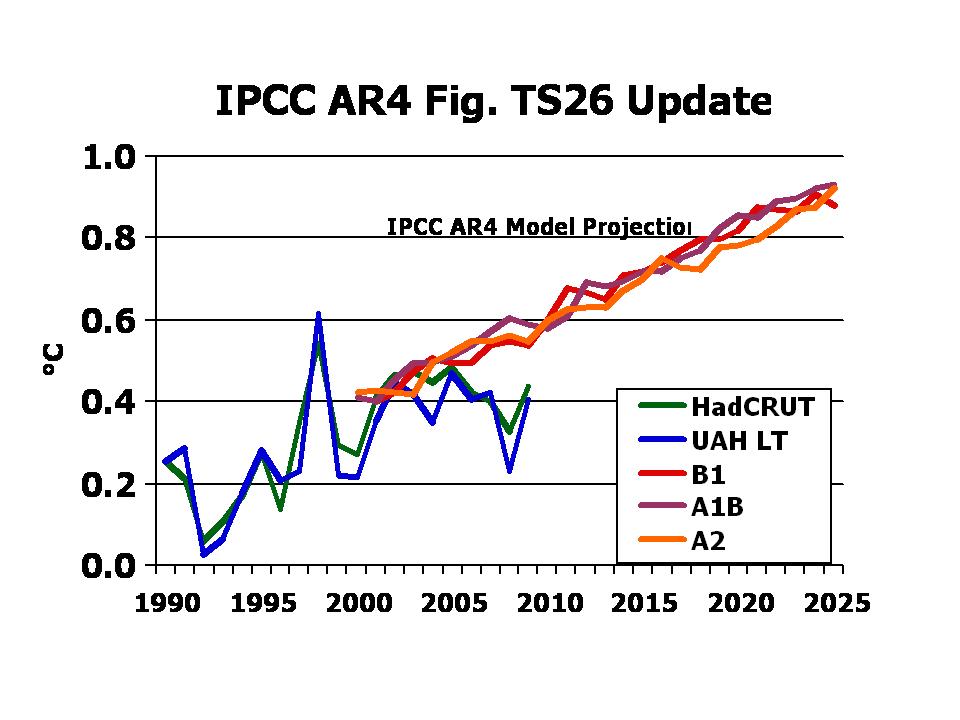
All three data centers have cooled the past and allowed data issues produce increasingly warm biases in the last few decades to ensure the data is more in line with their models (but even with the changes, it is falling far short). They have succeeded in ensuring they can claim ranking warm months and years but can’t yet match their models.
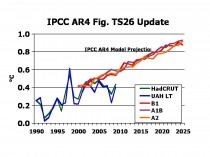
Enlarged here. Source John Christy UAH annual vs IPCC AR4 projected scenarios for temperatures.
Wait until the ocean cooling and long solar cycle 23 and wimpy cycle 24 evolves. See story here.