


By Joseph D’Aleo, CCM
Remember this story long ago on New York’s Central Park multiple very different data sets to which Steve McIntyre responded here.
Well NCDC has a shiny new very cool tool for plotting data for regions, states and some city locations by month(s), seasons, years. They describe it this way.
Data for the Contiguous U.S., statewide, climate divisions, climate regions, and agricultural belts come from the U.S. Climate Divisional Database, which have data from 1895 to the present.
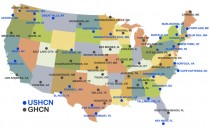
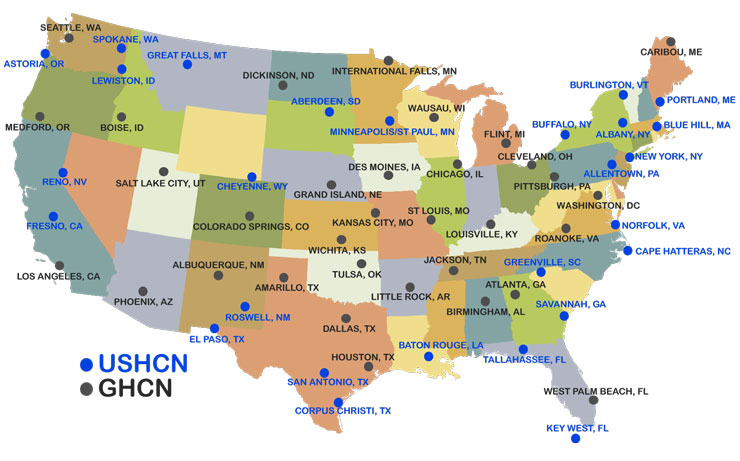
Information is also available at the city level for the following 60 cities. The 27 cities highlighted in blue below are Automated Surface Observing System (ASOS) stations which are part of the U.S. Historical Climatology Network (USHCN) (temperature data for the USHCN stations were converted to version 2.5 in October 2012). The other 33 cities use Global Historical Climatology Network (GHCN) data. These cities have data from varying beginning periods of record to the present.
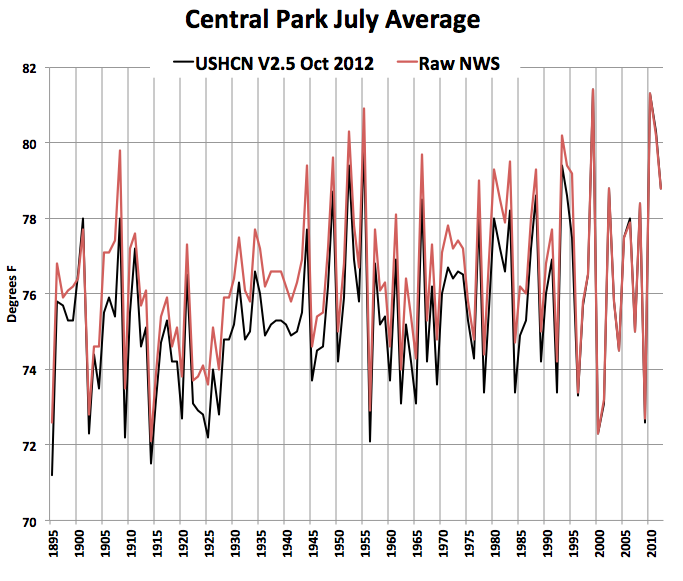
New York’s Central Park was one of the blue cities (new USHCN v2.5). So I plotted it for July since that was one of the months in the original comparison.
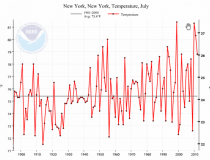
The surprise was how flat it was in the dust bowl heat of the 1930s. I know that on the NWS NYC web site, they have archived raw monthly means back well into the 1800s. So I downloaded that and compared.

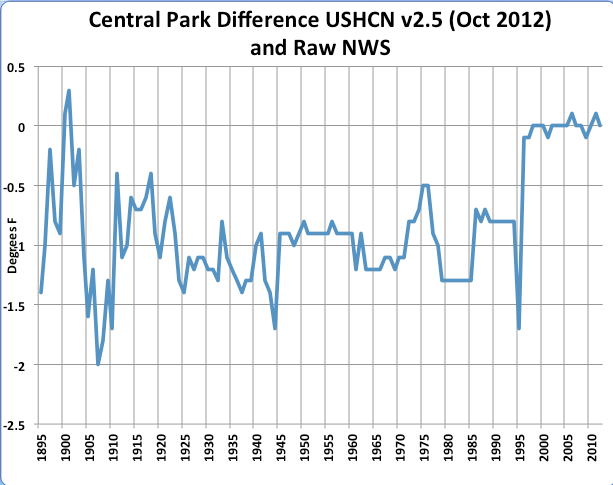
It was dramatically cooler in the NCDC v2.5 than the original data.
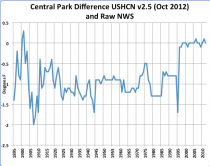
I maybe we need to coin a new term for NOAA NCDC - ‘dust bowl deniers’. Note the past is colder until recent decades. Yes it appears there is man made warming underway but the men are in Asheville, North Carolina.
================
Addendum by Anthony Watts:
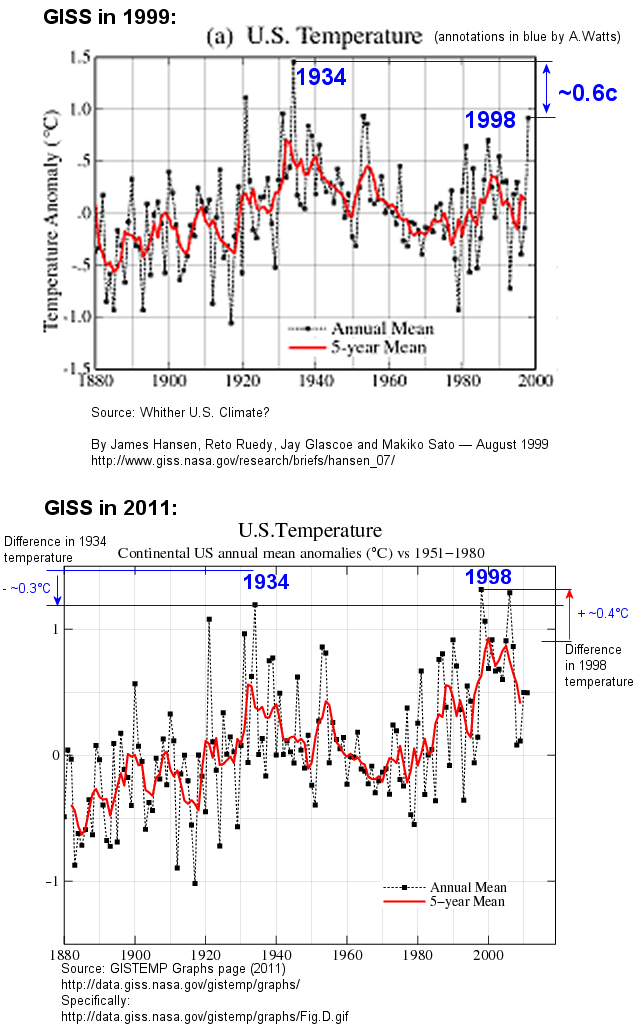
Cooling the past increases the trend. We’ve seen this effect happen several times before, yet there seems to be no justification for it. Probably this most dramatic example is what we see in this NOAA GISS plot comparison:

I’ve also written before about this tampering with data from the past. Such tampering with new adjustments like USHCN V2.5 allow claims of “warmest ever” to be made when the past gets cooled:
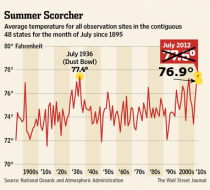
Dear NOAA and Seth, which 1930’s were you comparing to when you say July 2012 is the record warmest?
Does NOAA’s National Climatic Data Center (NCDC) keep two separate sets of climate books for the USA?
See many more examples here, here, here. Note this could be done for every state. If this was a corporation they would be indicted and jailed.