


By Joe D’Aleo, Icecap
We compared historical Central Park, NY data from the National Weather Service site in New York City as taken from the periphery of the park from 1909 to 1919 at the Arsenal Building 5th Ave (between 63rd & 64th) and then since 1920 at the Belvedere Castle on Transverse Rd (near 79th & 81st) with the Central Park data from NCDC Climate at a Glance USHCN database with HCN adjustments made to the NYC observations. We picked the two extreme months (January and July) for the comparison. The two data sets for July are plotted below.
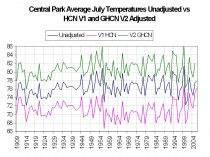
Note the adjustments were significant (a cooling exceeding 6 degrees from the mid 1950s to the mid 1990s.) Then inexplicably the adjustment diminished to less than 2 degrees. The result is what was a flat trend for the past 50 years became one with an accelerated warming in the past 20 years. It is not clear what changes in the metropolitan area occurred in the last 15 years to warrant a major adjustment to the adjustment. The park has remained the same and there has not been a population decline but a spurt in the city’s population in the 1990s.
See full story including the January differences here.
UPDATE: Also see Steve McIntyre’s interesting follow-up analysis on Climate Audit Central Park: Will the real Slim Shady please stand up?