


By Joseph D’Aleo, CCM, AMS Fellow
In the latest edition of Romm’s Fairy Tales on Climate Progress, Joe Romm tries to build a case that sea level rise which has been decelerating in recent years really will be a problem. In the story he warns total sea level rise for the east coast by 2100 could reach 6 feet. He even uses the MIT’s silly and widely scorned wheel of misfortune probability forecasts to bolster his case.
THE REAL STORY
The described changes in Greenland are not at all unprecedented nor are they as described. Many peer review papers support interaction with the Atlantic multidecadal cycles and other factors not greenhouse warming are the real drivers.
Changes to temperature and ice happen predictably every 60 years or so and is in fact entirely natural, related to multidecadal ocean cycles. Multidecadal cyclical warming was observed before in the 1800s and middle 1900s long before the industrial revolution. Also there is more recent evidence showing the idea of lubrication by melt water accelerating loss of glacial or icecap ice is not valid.
Most recently a study by van de Waal in Science showed as the New Scientist reported that “Much noise has been made about how water lubricates the base of Greenland’s ice sheet, accelerating its slide into the oceans. In a rare “good news” announcement, climatologists now say the ice may not be in such a hurry to throw itself into the water after all. Mother Nature, it seems, has given it brakes.
Since 1991, the western edge of Greenland’s ice sheet has actually slowed its ocean-bound progress by 10%, say the team, who have studied the longest available record of ice and water flow in the region.” They looked at how meltwater has correlated with the speed of ice flow at the western edge of the sheet, just north of the Arctic Circle, since 1991. They found that meltwater pouring down holes in the ice called “moulins” did indeed cause ice velocities to skyrocket, from their typical 100m per year to up to 400m per year, within days or weeks. But the acceleration was short-lived, and ice velocities usually returned to normal within a week after the waters began draining. Over the course of the 17 years, the flow of the ice sheet actually decreased slightly, in some parts by as much as 10%.
“For some time, glaciologists believed that more meltwater equaled higher ice speeds,” van de Waal says. “This would be kind of disastrous, but apparently it is not happening.” Van de Waal believes that the channels that carry the meltwater out to sea freeze up during the winter months. In summer, pulses of water rushing down the moulins to the bedrock overwhelm the narrowed channels, and the increased pressure lifts the ice sheet off the rock, enabling it to move faster.
However, after a few days the channels are forced open by the water, and it drains away from the glacier. As a result, the ice grinds back down against the bedrock and the lubricant effect is lost. NO LUBRICATION: Van De Waal says this indicates that, overall, meltwater has a negligible effect on the rate at which the ice sheet moves.”
Other scientists have confirmed that interannual variability is very large, driven mainly by variability in summer melting and sudden glacier accelerations. Consequently, the short time interval covered by instrumental data is of concern in separating fluctuations from trends. But in a paper published in Science in February 2007, Dr. Ian Howat of the University of Washington reports that two of the largest glaciers have suddenly slowed, bringing the rate of melting last year down to near the previous rate. At one glacier, Kangerdlugssuaq, “average thinning over the glacier during the summer of 2006 declined to near zero, with some apparent thickening in areas on the main trunk.”
Dr. Howat in a follow-up interview with the New York Times went on to add “Greenland was about as warm or warmer in the 1930’s and 40’s, and many of the glaciers were smaller than they are now. This was a period of rapid glacier shrinkage world-wide, followed by at least partial re-expansion during a colder period from the 1950’s to the 1980’s. Of course, we don’t know very much about how the glacier dynamics changed then because we didn’t have satellites to observe it. However, it does suggest that large variations in ice sheet dynamics can occur from natural climate variability.”
Thomas, et al. (2000) showed great variance in mass balance of the Greenland ice sheet with highly variable thickening and thinning depending on location. This February (2008) during a bitter cold winter, Denmark’s Meteorological Institute stated that the ice between Canada and southwest Greenland reached its greatest extent in 15 years.
Temperatures were warmer in the 1930s and 1940s in Greenland. They cooled back to the levels of the 1880s by the 1980s and 1990s. In a GRL paper in 2003, Hanna and Cappelen showed a significant cooling trend for eight stations in coastal southern Greenland from 1958 to 2001 (-1.29C for the 44 years). The temperature trend represented a strong negative correlation with increasing CO2 levels.
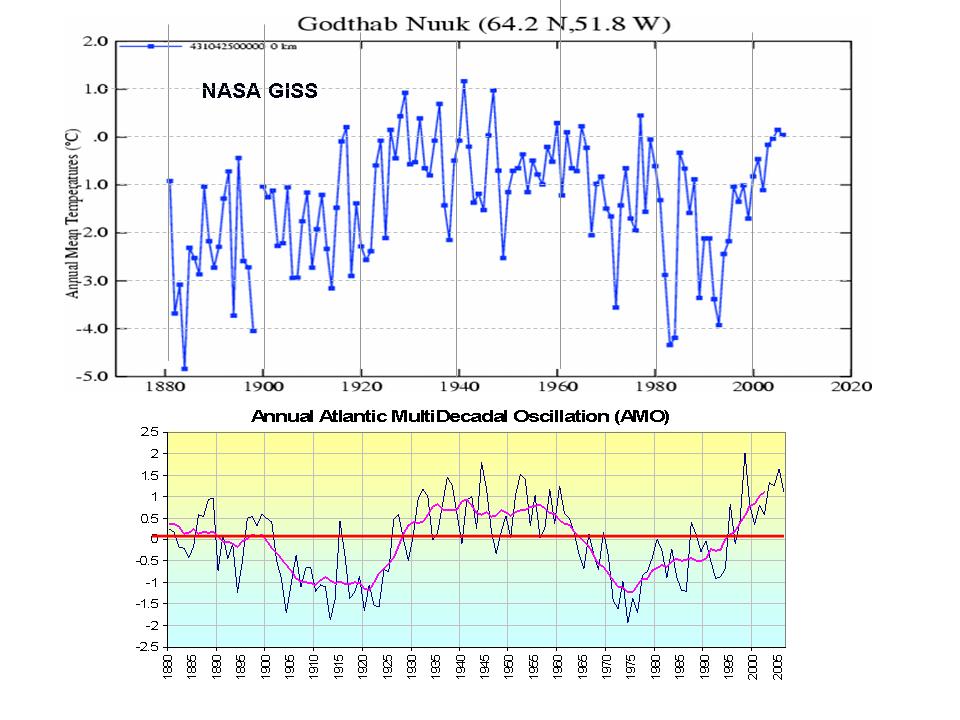
Shown below, see the temperature plot for Godthab Nuuk in southwest Greenland. Note how closely the temperatures track with the AMO (which is a measure of the Atlantic temperatures 0 to 70N). It shows that cooling from the late 1950s to the late 1990s even as greenhouse gases rose steadily, a negative correlation over almost 5 decades. The rise after the middle 1990s was due to the flip of the AMO into its warm phase. They have not yet reached the level of the 1930s and 1940s.
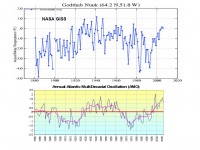
Large image here.
There are numerous recent peer review papers and a satellite data set that finds this is not true and in fact that the sea level rises have slowed in recent decades, most dramatically in the past few years as the oceans have cooled and contracted.
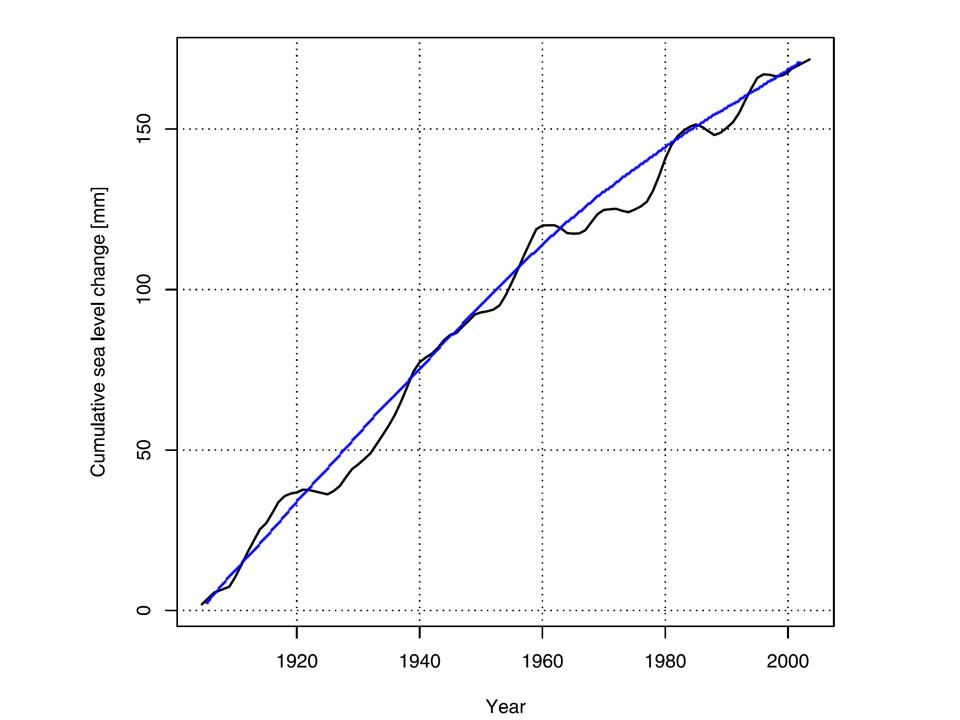
Holgate (2007) calculated that the mean rate of global sea level rise was “larger in the early part of the last century (2.03 plus or minus 0.35 mm/yr 1904-1953), in comparison with the latter part (1.45 plus or minus 0.34 mm/yr 1954-2003).” Idso noted with respect to the Holgate study “the century-long sea level history portrayed in the figure below is suggested by the blue curve we have fit to it, which indicates that mean global sea level may have been rising, in the mean, ever more slowly with the passage of time throughout the entire last hundred years, with a possible acceleration of that (declining) trend over the last few decades.”
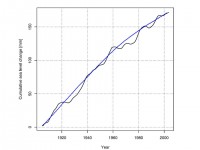
See larger graph here.
This is supported also by the sea levels as measured by Jason TOPEX.
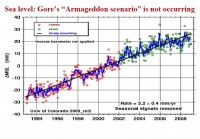
Sea larger graph here.
Read full analysis of Greenland and sea level here.
UPDATE: Read this earlier Peter Glover comprehensive recap of the world icecap and glacier situation in the American Thinker here.