By Frank Lansner
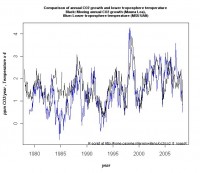
I came across Hans Errens illustration showing the yearly growth in CO2 concentration as a function of UAH global temperatures:

See larger image here.
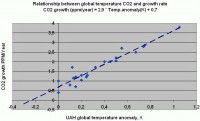
It appears from this graph that CO2 concentrations follows temperature with a lag of approximately 6-9 months. The interesting part is of course that the CO2 trends so markedly responds to temperature changes. I wanted to get a clearer picture of this relationship, and thus took approximately 20 datasets from this graph And plotted them in a scatter graph to see the trend, and got the following result:

See larger image here.
The equation is built on data in the big range from CO2 growth 0.5 to 3.5 ppm/year, and all fits fine the very same trend. So in real world today we have a CO2-growth as a function of temperature approximately: CO2 growth (ppm/year) = 2.9 temp.anomaly(K) + 0.7 . And we see that if UAH temperature anomaly should reach - 0.3 K, CO2 growth should stop.
What are the consequences?
1) The quick response up and down for CO2 trend shortly after temperature changes suggests that we see a “dance” around equilibrium conditions in nature.
2) The equation confirms that despite human or other contributions to CO2, the CO2 trend is very sensitive to temperature. This is a fact. For example if temperature rises 0.5 degrees and this trend holds for around 30 years, we should see a trend of approx 1.5 ppm CO2/year, over 30 years adding up to a net CO2 build up of 45 ppm.
Is it realistic then, that CO2 concentration should have been constant within a 15 ppm band for almost 1000 years? This would require extremely constant temperatures. Even temperatures from IPCC AR4 could not fulfil such invariability it would take to keep CO2 almost unchanged. Read more here
See the detailed Dr. Jeffrey Glassman paper The Acquittal of Carbon Dioxide that found the same thing in the ice core data here.


