


Dr. Don J. Easterbrook, Western Washington University, Bellingham, WA
The October 18, 2011 post on Skeptical Science entitled “How Global Temperatures Predictions Compare to What Happened (Skeptics Off Target)”by ‘Dana 1981’ claimed that “the IPCC projections have thus far been the most accurate” and “mainstream climate science predictions… have mostly done well.... and the “skeptics” have generally done rather poorly.” “"several skeptics basically failed, while leading scientists such as Dr. James Hansen (a regular climate activist, as well as the top climatologist at NASA) and those at the IPCC did pretty darn well.” Figure 1 shows a graphical comparison of predictions vs. observations as portrayed by Dana1981.
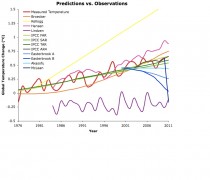
Figure 1. Temperature predictions vs. observations as portrayed by Dana1981. Enlarged.
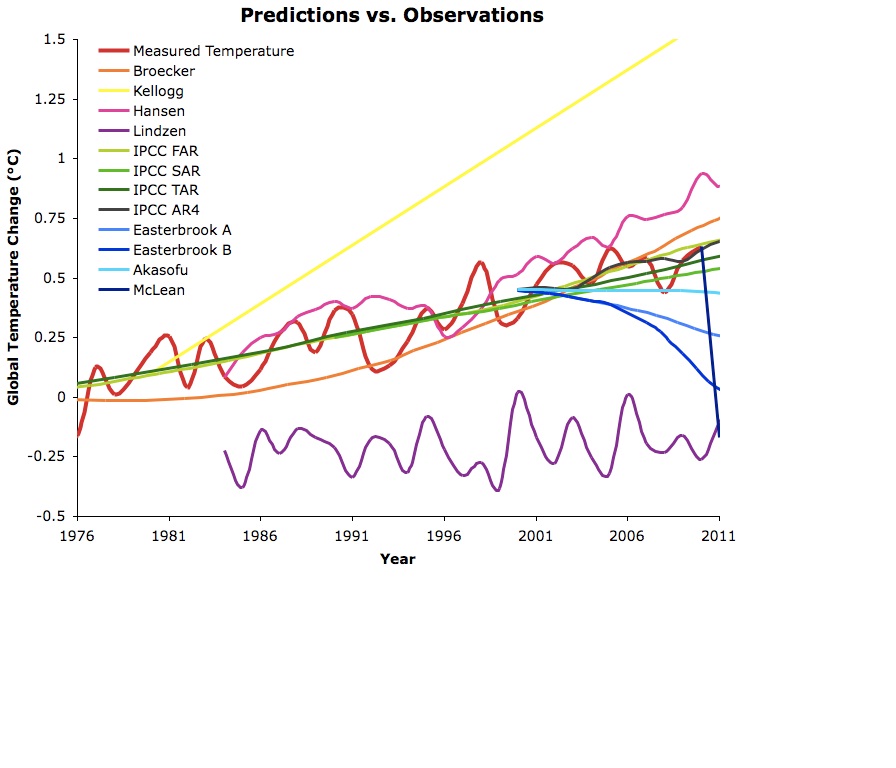
However, the graph and these statements seemed to fly in the face of data, which show just the opposite - that computer models have failed badly in predicting temperatures over the past decade. So how could anyone make these claims? Figure 2 shows the IPCC temperature predictions from 2000 to 2011, taken from the IPCC website in 2000. Note that their projection is for warming of 0.6C (1.1F) between 2003 and now.

Figure 2. IPCC global warming prediction from the IPCC website in 2000. Enlarged.
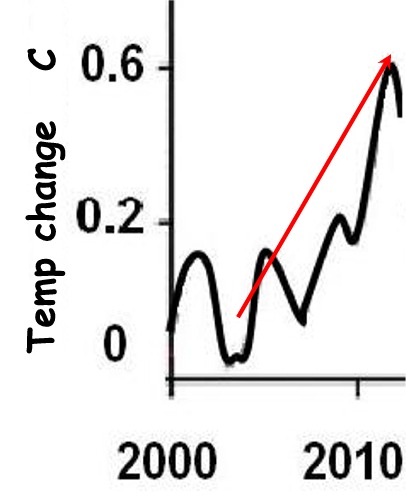
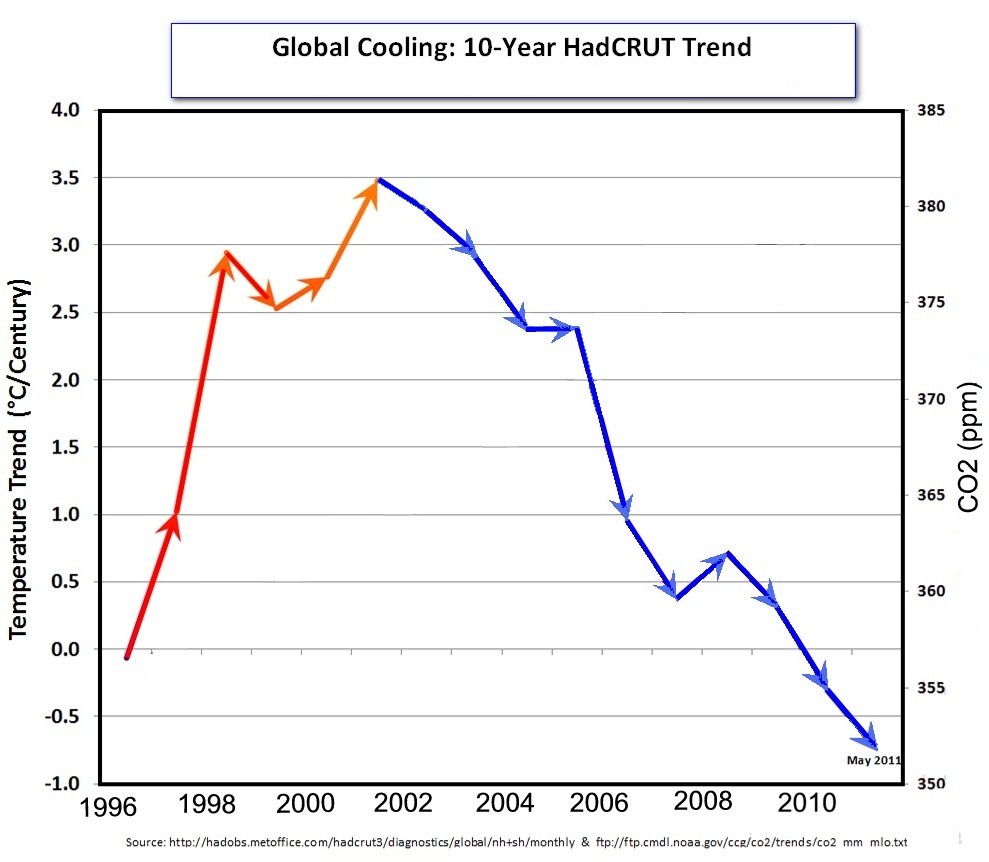
How close is the IPCC projected warming to the measured temperatures? Figure 3 shows a 10-year cooling trend, so how can the computer-model projected warming, (0.6C, 1.1 F) warming be considered accurate?
Figure 3. Ten-year cooling trend from 2001 to 2011. Enlarged.
What’s wrong with Figure 1?
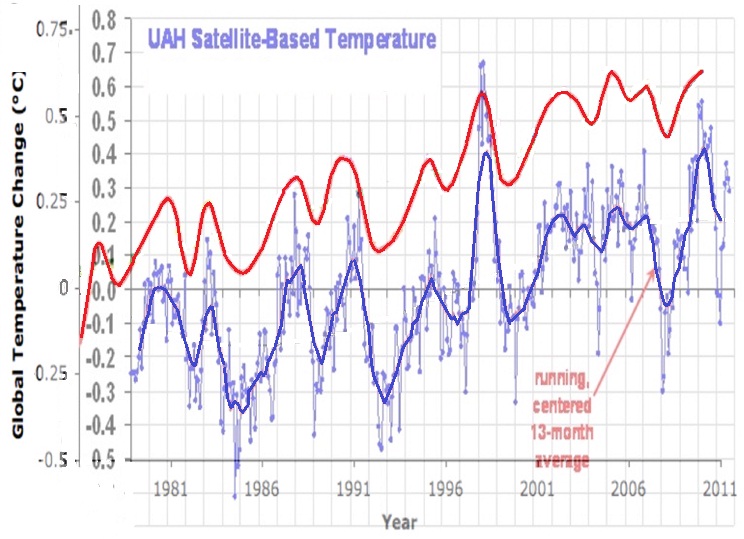
The comparison of various predicted temperature curves and what is labeled “Measured temperature” in Figure 1 is definitely at odds with Figures 2 and 3. How can the IPCC computer model predictions of a full degree of warming (F) (0.6 C) in the past decade and temperature predictions of Hansen and Broecker be consistent with no global warming in the past decade (in fact, slight cooling)? Something is badly off base here. One possibility is that the ‘Measured temperature’ curve in Figure 1 is too high, taking it into the temperatures of model predictions, so I took the UAH satellite temperature curve from 1979 to Sept. 2011 (available at http://www.drroyspencer.com/latest-global-temperatures/) and dropped it onto Figure 1. The result (Figure 4) was rather startling. What is immediately apparent is that the temperatures plotted in Figure 1 are nearly half a degree C higher than the UAH temperatures! No source is given for the red temperature curve in Figure 1, but it seems to generally mimic the UAH temperatures, rather than ground-measured temperatures.
Figure 4. Comparison of UAH satellite global temperatures (blue curve) with temperatures plotted in Figure 1 (red curve). Enlarged.
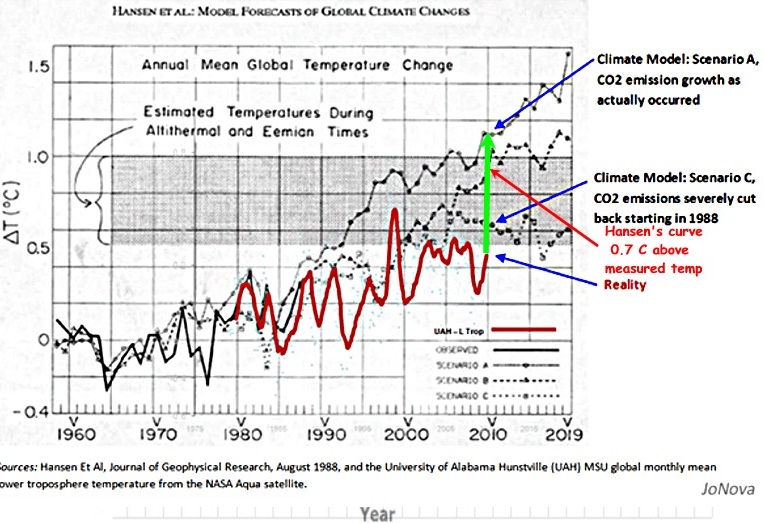
Figure 5 corroborates that Hansen’s 1988 temperature curve is 0.7C higher than the UAH measured temperature curve. By no stretch of the imagination can his prediction be considered ‘accurate!’Enlarged.
As for the skeptics predictions, mine were based on recurring climate cycles that can be traced back at least 400 years, long before CO2 could have been a factor. Using the concept that’‘the past is the key to the future,’ I simply continued the past, well-documented temperature patterns into the future and offered several possible scenarios beginning about 2000: (1) moderate, 25-30-year cooling similar to the 1945 to 1977 cooling, (2) more intense, 25-30-year cooling, similar to the more severe cooling from 1880 to 1915, (3) more severe, 25-30-year cooling similar to the Dalton Minimum cooling from 1790 to 1820; or very severe cooling (the Little Ice Age) similar to the Maunder Minimum cooling from 1650 to 1700. So far, my cooling prediction, made in 1998, appears to be happening and is certainly far more accurate than any of the model predictions, which called for warming of a full degree F. So far cooling this past decade has been moderate, more like the 1945-1977 cooling, but as we get deeper into the present Grand Solar Minimum, the cooling trend may become more intense.