


The beneficial gas CO2 is demonstrated by Dr Craig Idso from CO2 Science, an organization trusted by NOAA to be a center that displayed US station data prior to the development of NCDC/NCEI.
Junk models using fraudulent data have been used to try and convince the world CO2 is bad and we need to rid it by eliminating all fossil fuels which output CO2.
Dr. Patrick Moore, Ecologist and co-founder of Greenpeace shows this also.
See how ice core data exposes the big lie about man made unprecedented warming.
---------------------
The models used to estimate U.S. deaths from COVID19 had projections that ranged from over 2 million two months back to 100,000-240,000 and then down to 60,000. Most hoped they would come down further, but the numbers blew past the 60,000. A lot of uncertainty exists in the data still though as an unknown number of the deaths attributed to COVID19 may really have been due to other morbidities and also some point out health care institutions are financially better off with a COVID19 cause of death.
The media seemed perplexed about the large changes in the models and questioned their concept and value. Welcome to the world of modeling (see this comparison).
We in the weather business use models as a tool and they present special challenges. We have a plethora of models to choose from which run 2 to 4 times a day or even on a smaller scale hourly. Operational model forecasts go out to as far 16 days into the future. The models are subject to large errors especially in the latter periods when storms are coming inland from data sparse regions like the Pacific. We have a favorite phrase - garbage in, garbage out.
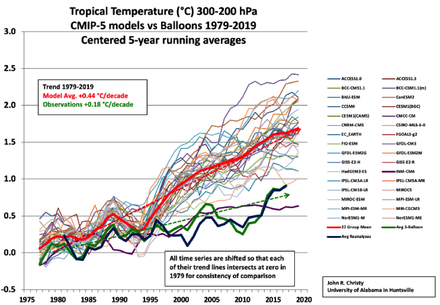
The climate model story is even worse. The climate models overstate the warming from greenhouse gases by a factor of two or more.
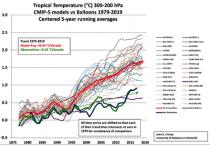
Climate model forecasts versus the satellite and balloon observations
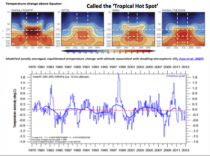
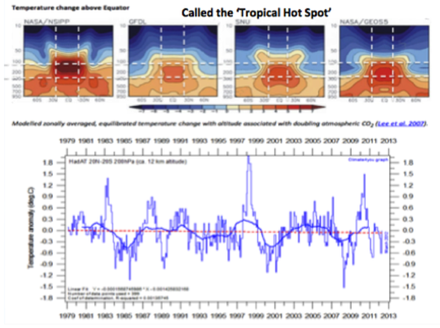
The models projected the greatest warming in the tropical high atmosphere (called the Tropical Hot Spot) where air in the mean rises due to convergence of air from both hemispheres. But the models warming results mostly from the release of heat from condensation of water vapor (95% of the greenhouse effect). CO2 is a trace gas, just 0.04% of the atmosphere by volume.
See no warming trend in the upper atmosphere since 1979 where models predict it.
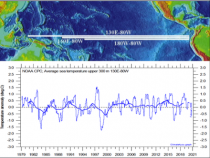
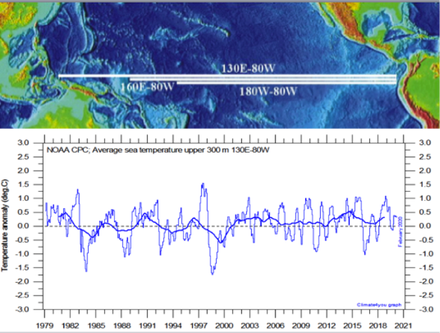
The lack of warming also holds for the tropical Pacific ocean down to 300 meters depth from 160E to 80W.
Climate scientist Stefan Rahmstorf in DER SPIEGEL actually admits quietly that the models are crap, running way too hot here.
HOW THEY DEAL WITH LACK OF REAL DATA AT GROUND LEVEL
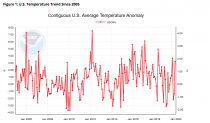
The lack of warming is documented by the National Oceanic and Atmospheric Administration’s U.S. Climate Reference Network, an extremely accurate network of temperature stations throughout the United States that requires no corrective adjustments. (It began reporting temperature data in 2005.) When climate activists claim specific impacts of global warming in the United States, those impacts could not have been caused by any recent warming because no significant recent U.S. warming has occurred.
On a global scale the climate cabal portray the output from their models as gospel, and the believers confuse the model projections with measured data. The data centers make unsubstantiated claims that a given month or year is the warmest back to the beginning of the record (1880 or even 1850) often by the tiniest of margins (0.05C for example).
But the data is just not there to make those claims.
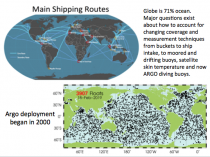
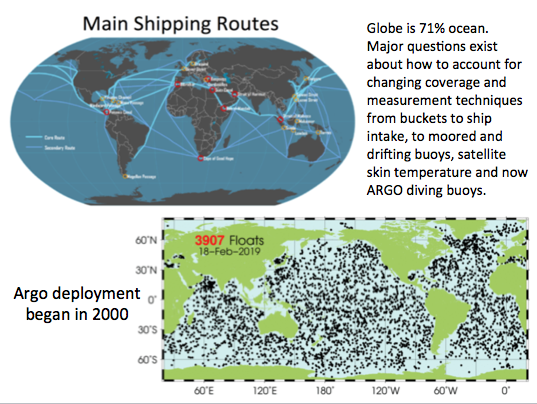
71% of the earth is oceans, and data before the satellite data became available 40 years ago, ocean data was reliant on ships which travelled along specific routes mainly in the northern hemisphere near the land.
A large percentage of land surface was erratically covered with observing sites and the data too often spare and intermittent.
To create an apparent agreement with their sacred models, the data centers manipulated real data or even generated with their models data for 95% of the planet that had poor coverage before the satellite era.
MIT’s climate scientist Dr. Mototaka here exposed the phoney claims that most years are the warmest ever since the 1850s of 1880s.
“The supposed measuring of global average temperatures from 1890 has been based on thermometer readouts barely covering 5 per cent of the globe until the satellite era began 40-50 years ago. We do not know how global climate has changed in the past century, all we know is some limited regional climate changes, such as in Europe, North America and parts of Asia.”
The world’s greatest scientists in the 1970s knew that and created the first view of global trends by using land temperatures where available in the Northern Hemisphere. It showed a 2F warming from 1880s to around 1940 and then a cooling that by around 1970s cut that by more than half. Further cooling until the late 19870s virtually eliminated the rest.
_thumb.jpg)
These early measurements were erased when models and global land (and ocean) data was ‘created’ in the following decades. The models cooled the early data and enhanced the warming to create an apparent steady warming during the eras when fossil fuel use increased. Our conclusion is that there is man made global warming but the men are in NOAA, NASA and Hadley.
_thumb.png)
By the way, the ocean data coverage and accuracy did not really become reliable until the implementation of the ARGO buoys in 2000 designed to accurately measure temperatures and ocean heat content. Like the satellite used to measure sea level changes (which showed no changes - until artificial adjustments were made), the early results were disappointing - showing no warming. The ARGO data supported the inconvenient near two decade pause in the warming that started in the late 1990s.
_thumb.png)
Eventually in desperation ahead of the Paris Accord, they made this go away by adjusting the buoy data to match to inferior ship data.
_thumb.png)
.jpg)
.jpg)
.png)
.jpg)
The models are tuned to manipulated (fraudulent) data. In addition to what we have shown above, this can be seen when you examine all the extremes of weather that these models and the theories predict. See here how each of the claims have failed.
SUMMARY
COVID19 has shown how major the impact on the global population a pandemic can bring. A Green New Deal wasn’t developed in a lab, but is as bat shit crazy and would have a major impact on life as we know it. The effect on our economy would not be as sudden but just as serious. The government would not be sending you checks in the mail to help but driving up the cost of energy, and the cost of living and the choices you make (cars you drive, where you can live, how much you can make and keep). Because it is based on junk science, we need to dispatch it as quickly as we can the COVID19.
See much more on this issue in this presentation in front of New Hampshire Taxpayers.
(See this comparison of climate models to COVID19 models). And go to this must see video on the fraud behind COVID19.