


By Anthony Watts with additions by Joe D’Aleo
Over at JunkScience.com Steve Milloy writes:
Skeptic Setback? ;New’ CRU data says world has warmed since 1998 But not in a statistically significant way.
Gerard Wynn writes at Reuters:
Britain’s Climatic Research Unit (CRU), which for years maintained that 1998 was the hottest year, has published new data showing warmer years since, further undermining a sceptic view of stalled global warming.
The findings could helpfully move the focus from whether the world is warming due to human activities - it almost certainly is - to more pressing research areas, especially about the scale and urgency of human impacts.
After adding new data, the CRU team working alongside Britain’s Met Office Hadley Centre said on Monday that the hottest two years in a 150-year data record were 2005 and 2010 - previously they had said the record was 1998.
None of these findings are statistically significant given the temperature differences between the three years were and remain far smaller than the uncertainties in temperature readings…
And Louise Gray writes in the Telegraph: Met Office: World warmed even more in last ten years than previously thought when Arctic data added
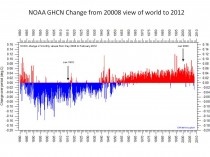
Some of the change had to do with adding Arctic stations, but much of it has to do with adjustment. Observe the decline of temperatures of the past in the new CRU dataset:
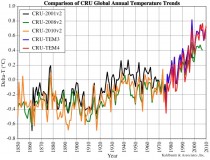
Enlarged
Data plotted by Kahlbaum/Wolff. This plot has saved versions (thanks to Craig Loehle) from 2001, 2008, downloaded versions from 2010, 20111 and the new HADCRUv4. Each iteration increases the trend by cooling the past and warming the present. Of course, this is just “business as usual” for the Phil Jones team.
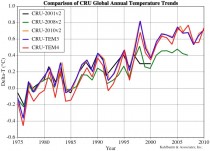
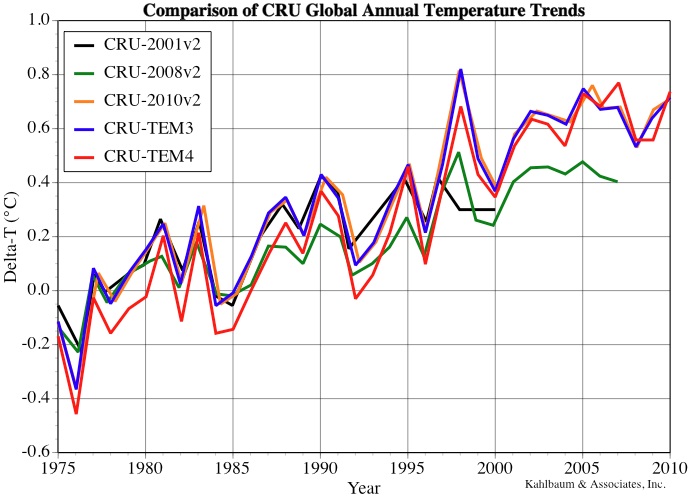
Here is a close-up on more recent years, see how much warmer CRU3 and CRU4 in 2011, 2012 are than CRU3 in 2010. The 2011 and 2012 may be land only compilations. ironically they track well with the 2010 version until 1997 then diverge. More updates to follow.
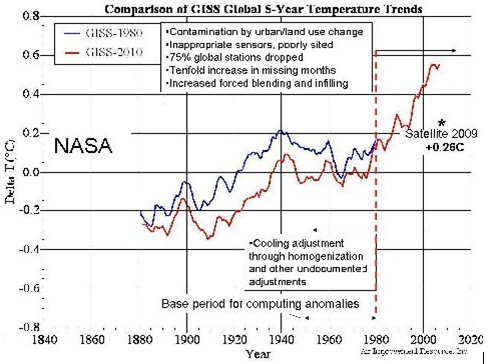
On the other side of the pond, here’s the NASA GISS 1980 data set compared with the 2010 version. More cooling of the past.

Enlarged
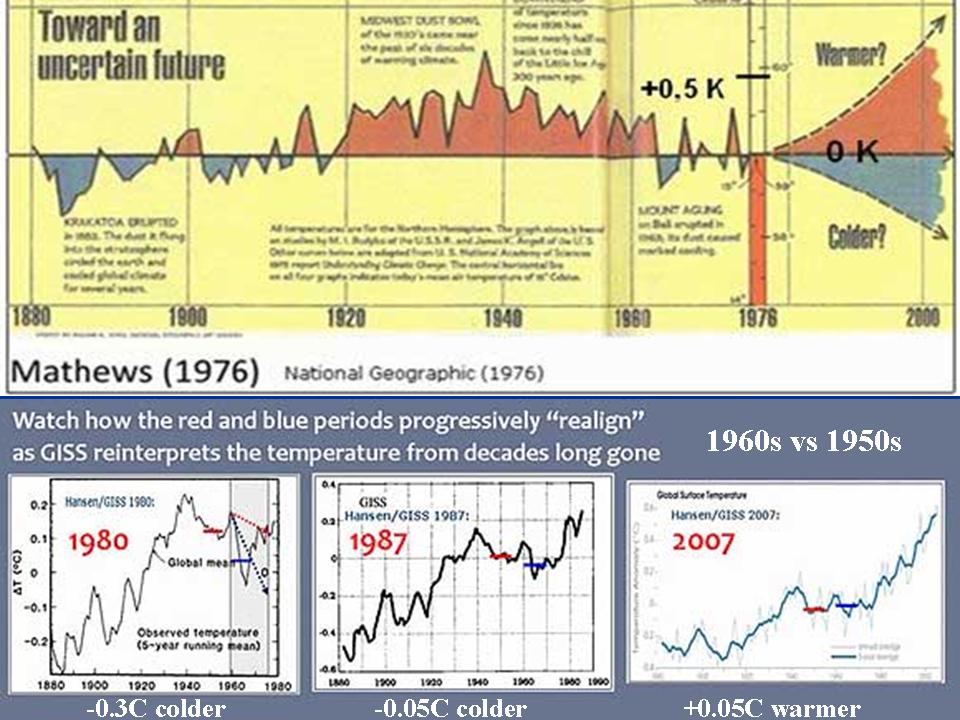
And of course there’s this famous animation where the middle 20th century got cooler as if by magic. Watch how 1934 and 1998 change places as the warmest year of the last century. This is after GISS applied adjustments to a new data set (2004) compared with the one in 1999
Hansen, before he became an advocate for protest movements and getting himself arrested said:
The U.S. has warmed during the past century, but the warming hardly exceeds year-to-year variability. Indeed, in the U.S. the warmest decade was the 1930s and the warmest year was 1934.
Source: Whither U.S. Climate?, By James Hansen, Reto Ruedy, Jay Glascoe and Makiko Sato - August 1999
In the private sector, doing what we see above would cost you your job, or at worst (if it were stock data monitored by the SEC) land you in jail for securities fraud. But hey, this is climate science. No worries.
And then there’s the cumulative adjustments to the US Historical Climatological Network (USHCN)
The result is a cooling of the past and a warming of recent data and thus an enhanced apparent warming trend.
All up these adjustments increase the trend in the last century. We have yet to witness a new dataset release where a cooling adjustment has been applied. The likelihood that all adjustments to data need to be positive is nil. This is partly why they argue so fervently against a UHI effect and other land use effects which would require a cooling adjustment.
As for the Arctic stations, we’ve demonstrated recently how those individual stations have been adjusted as well: Another GISS miss: warming in the Arctic - the adjustments are key
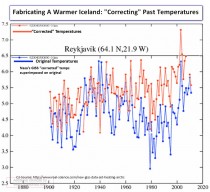
The two graphs from GISS, overlaid with a hue shift to delineate the “after adjustment” graph. By cooling the past, the century scale trend of warming is increased - making it “worse than we thought”.
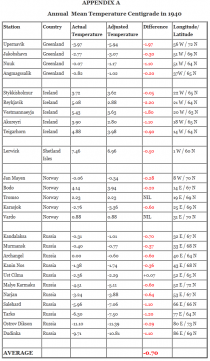
And here is a summary of all Arctic stations where they cooled the past: The values are for 1940. and show how climate history was rewritten:
CRU uses the same base data as GISS, all rooted in the GHCN, from NCDC managed by Dr. Thomas Peterson, who I have come to call “patient zero” when it comes to adjustments. His revisions of USHCN and GHCN make it into every global data set.
Watching this happen again and again, it seems like we have a case of:
Those who cool the past are condemned to repeat it.