Globally August Was Coldest In Five Years, Second Coldest In Ten Years
By Steve Goddard
Contrary to the spectacular “hottest August ever” lies being propagated by NASA GISS and NOAA ahead of Obama’s climate conference - August was the coldest in five years and the second coldest in 10 years, according to far more accurate NASA satellite data.
----------
Joe D’Aleo, CCM Hudson Litchfield News
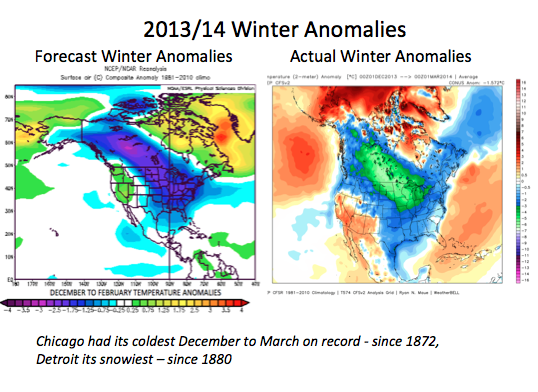
Summer passed quietly. Concord had just three 90F days this year (one 90F, one 91F and one 92F, all in July) and the average for June to August was half a degree below normal. Concord had as many as 29 days at or above 90F (1955) and as few as zero (5 times, the most recent 1996). For the central and eastern U.S., it was the cool summer we at WeatherBELL.com had forecast back in January. It followed a brutal winter and cold spring.
_thumb.png)
We warned as early as June 2013, that last winter would be an historic one and it was for the Great Lakes region (Chicago had its coldest December to March in its entire record back to 1872 and Detroit its snowiest winter since 1880). Ice on the Great Lakes was the greatest since they have been tracking it and was still seen in June on Lake Superior. For Concord, the winter averaged 3.1 F below normal, the 29th coldest in 146 years. March in Concord was 7.4 below normal, the fourth coldest March on record. All the colder March years were in the 1800s.

With all the climate factors aligning, next winter in the east and southeast should be even colder than last year. Plan accordingly. Come join us at Weatherbell.com to see the details.
Meanwhile The National Climate Data Center (NCDC) and the media has ignored the cold and headlined how the months have globally been the warmest ever. What gives? What if I told you NCDC (which supplies all the global data centers with the data they do their analysis with) has been ‘tinkering’ with the data to fit the politically correct story (budgets depend on it you know).
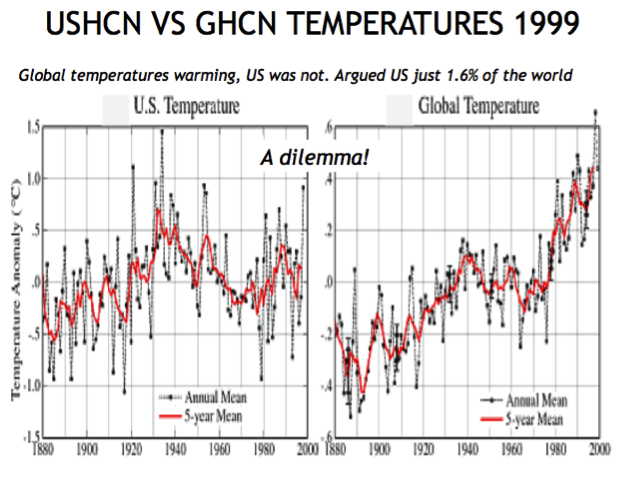
Back in 1990, NCDC introduced a data set for US (US Historical Climate Network USHCN), that was regarded by all to be the best in the world. It showed the warming in the 1920s and 1930s that peaked around 1940, a cooling trend that went through to the late 1970s followed by a rise similar to the early century that continued until the late 1990s. NASA’s James Hansen who first publicly proclaimed global warming in 1988, admitted in 1999 on the NASA GISS temperature site “The U.S. has warmed during the past century, but the warming hardly exceeds year-to-year variability. Indeed in the U.S., the warmest decade was the 1930s and the warmest year was 1934.”
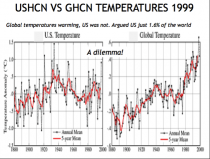
This US data set was a problem for the politicians and NCDC. The U.S. temperature record was at odds with the reported Global Historical Climate Network (GHCN) trend, which showed the second 60 year cycle peak considerably higher (0.5C) than the one near 1940, and a much weaker cooling trend mid century. The reason was the US had an correction for the urban heat island effect designed by NCDC’s own Tom Karl. The global data had no such adjustment. Most of the global stations were cities and this urban warming, we are all familiar with contaminated the data in a big way.
This inconvenient fact did not delight the politicians, hoping to use global warming to impose taxes, gain control over our energy sector and build support for more global governance under the UN. In 2008, NCDC resolved the discrepancy by removing the urban heat island adjustment in the US data and suddenly 1934 instead of being 1.1F warmer than 1998 was 0.1F colder. Though the 60 year cycle, tied to the ocean multidecadal cycles was still evident, the new trend was more like the global.
They also added a new step where they blend (homogenize) stations together which has the effect of taking some of that urban warming and having it appear in the rural stations. Most striking in the new data sets is a major cooling of the early part of the record - not easily explained by either the urban or homogenization steps - which makes it appear that there has been an increasing temperature trend.
It seems other meteorological services around the world are playing the same games.
The Australian Bureau of Meteorology (BOM) has been accused of manipulating historic temperature records to fit a predetermined view of global warming. Researcher Jennifer Marohasy claims the adjusted records resemble “propaganda” rather than science. Dr Marohasy analyzed raw data from dozens of locations across Australia and matched it against the new data used by the BOM showing that temperatures were progressively warming. In many cases, Dr Marohasy said, temperature trends had changed from slight cooling to dramatic warming over 100 years.
I could show you literally hundreds of examples of this reversal of trends in the data in the US and throughout the world (see this for Iceland).
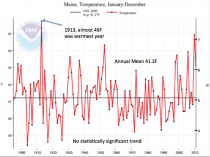
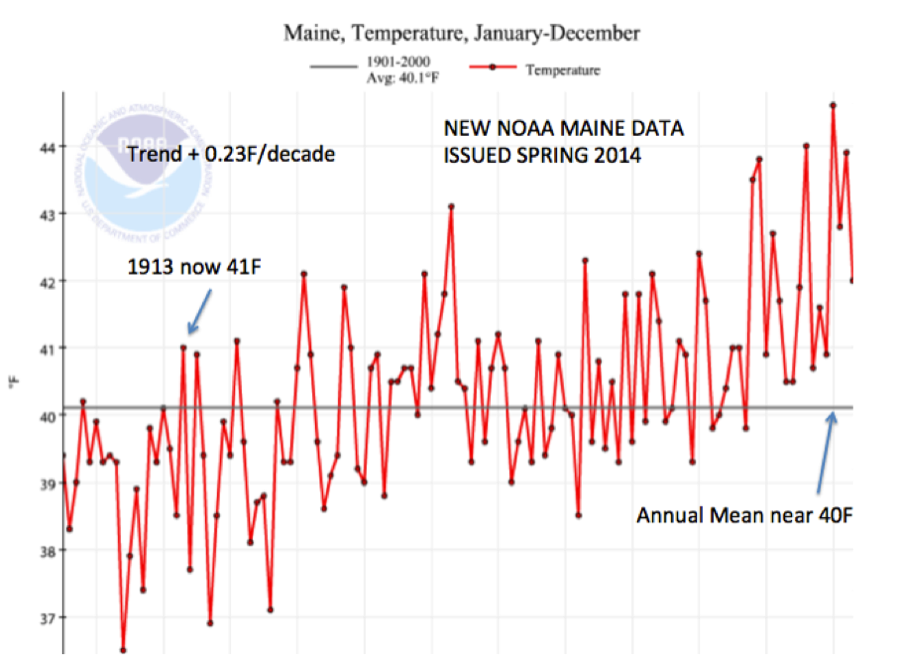
Meanwhile, this tampering has now made its way down from the national to the state level. NCDC made yet another change this spring to how it calculates past state wide average temperatures. If you downloaded from NCDC the Maine state average annual temperature plot in March, you would have seen no real long-term trend for annual temperatures (-0.03C/decade) since 1895. 1913 was the warmest year - almost 46F for the annual average. The annual mean was 41.2F. 2012 was second warmest year, just short of 45F.
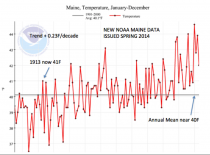
This spring after NCDC announced a new and better version of their state data. I downloaded the new Maine annual temperatures and found a remarkably different story. 1913 was cooled to 41F (almost 5F lower) and the average cooled to 40F. 2012 was now the warmest year, over 3F warmer than 1913. The long-term trend jumped to +0.23F/decade, the highest of any state.
.png)
Michael Crichton, MD, PhD and author of State of Fear warned, in 2003
“I have been asked to talk about what I consider the most important challenge facing mankind, and I have a fundamental answer. The greatest challenge facing mankind is the challenge of distinguishing reality from fantasy, truth from propaganda. Perceiving the truth has always been a challenge to mankind, but in the information age (or as I think of it, the disinformation age) it takes on a special urgency and importance.”
When you hear NOAA (not your trustworthy local office but the Climate Data Group in Asheville) and the media and political campaign ads make claims about August and seasons globally being the warmest ever and how big oil is to blame, please keep this in mind. It is not big oil, it is big money that feeds the ideological monster that continues to turn some of our universities into centers of mediocrity and threatens our nation’s energy security and (as a consequence) our lives.