


By Joseph D’Aleo, CCM, Weatherbell Analytics (Weatherbell.com)
Location, location, location is important for a lot of things...where you live, where you locate your business, especially retail and where you locate your instruments.
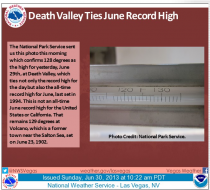
This is a picture from 1922 proudly shown by the NWS of the instrument shelter at Death Valley where 100 years ago, the world’s record of 134F was set.
They show the same kind of white painted Stevenson Shelter is used today. it is unclear whether is on dirt as it appears to be in 1922 or cement.
The WMO specifies that temperature instruments should be 5 1/2 feet above a grassy surface 100 feet or more from a heat source and away from structures that can affect ventilation.
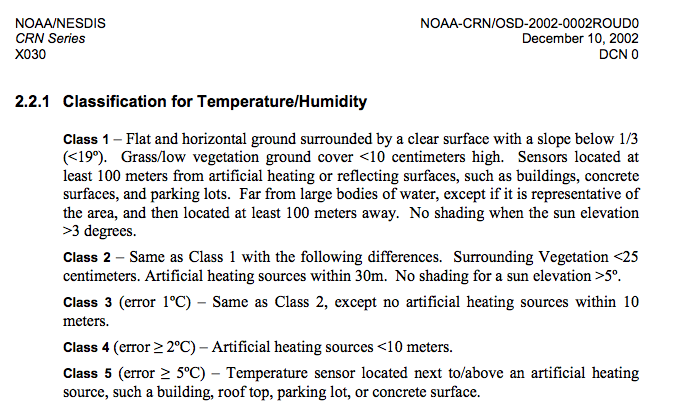
NOAA established special criteria and a ranking system for evaluating siting for the Climate Reference Network.
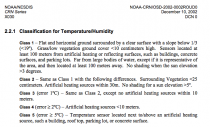
Enlarged
When Anthony Watts in the surfacestations.org surveyed 1007 of the 1221 US stations, they found the vast majority did not meet the criteria for placement. Here is what his team using on site photography and google earth satellite views found:
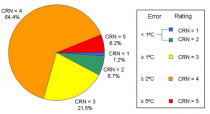
Only 1.2% of the stations met the criteria for CRN 1 and 6.7% CRN2. However 70.6% were poorly sited with CRN 4 or 5. Here is some examples from a working document a few years back I authored with Anthony.
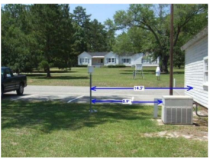
USHCN climate station in Bainbridge, GA, showing the MMTS pole sensor in the foreground near the parking space, building, and air conditioner heat exchanger, with the older Stevenson Screen in the background located in the grassy area.
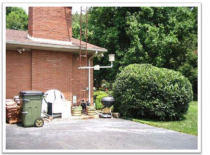
USHCN weather station at Hopkinsville, KY (Pielke et al., 2006). The station is sited too close to a building, too close to a large area of tarmac, and directly above a barbecue.
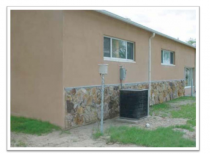
Max/Min temperature sensor near John Martin Reservoir, CO (Davey, 2005)
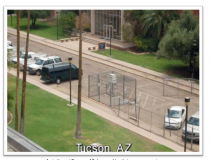
A station at Tucson, AZ, in a parking lot on pavement
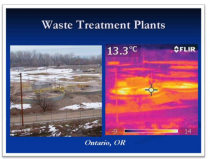
Numerous sensors are located at waste treatment plants. An infrared image of the scene shows the output of heat from the waste treatment beds right next to the sensor.
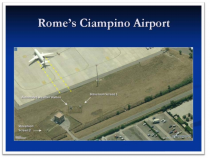
Many sites are on or adjacent to tarmacs at airports some affected by exhaust.(Photo from Bing Maps, located by Paolo Mezzasalma, annotated by Anthony Watts.)
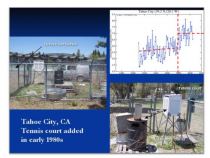
The station at Tahoe City, CA, was changed in the early 1980s, when a tennis court was built adjacent to it. The shelter was surrounded by a chain link fence but unwisely they put a trash burn barrel within 5 feet. See the discontinuity in temperature after the site changes.
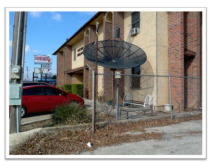
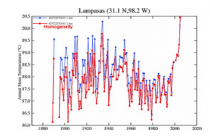
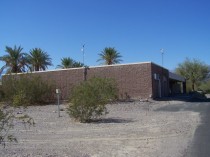
The site at Lampasas, TX, moved close to a building (below) and a street from a more appropriate grassy site after 2001. Note even with the GISS “homogeneity” adjustment (red) applied to the NOAA adjusted data, this artificial warming remains although the old data (blue) is cooled to accentuate warming even further.
When Anthony and a team or scientists published on the siting issue, NOAA quickly removed some of the worst offenders but their own Inspector General scolded NOAA for not doing due diligence in siting, after documenting there were over 40% of stations not meeting minimum standards.
In his new draft paper to be published they showed the importance of siting and how the adjustments made by NOAA to supposedly fix the site contamination issue, actually accentuate the warm bias.
_thumb.png)
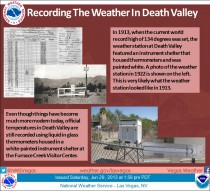
By the way, the surfacestations.org site suggests they have moved the shelter and added a thermistor thermometer which was used for official measurements for 12 years. See here however, how they decomissioned the MMTS instrument and returned to liquid in glass perhaps because the MMTS is cooler, as it shielded better against solar heating. Could it be they thought they could break the world record sooner with the old technology with its established warm bias?
See here how a new paper finds that aging weather stations record much higher daytime temperatures, 1.63C higher than new stations.
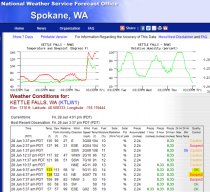
To show you how instrumentation can go wacky look at this graphic from the Washington state mesonet.
There the temperature was shown to rise from 57 at 5:37am after 0.33 inches of rain to 139F at 8:37 am (notice the dewpoint of 122). It drops to 117F at 12:37pm but then pops again to 137 at 2:37pm. The Quality Control program column calls the 139 and 137 suspect but says the 133F at 9:37 am with a dewpoint of 113F was OK.
This reminds me of when I was in England in 1996 launching a cable weather network, when the local newspaper had a column story about an elderly woman who was found stabbed 17 times in her flat. The reporter interviewed the constable who said “Foul play could not be ruled out”. Ya think?
By the way, a big 100th anniversary party is scheduled at Death Valley on July 10th, the day in 1913 it set what was named now the world’s highest temperature. Members of WeatherUnderground (so appropriate since Death Valley is below sea level) and TWC will be there). Here’s hoping for thunderstorms and temperatures in the 90s. By the way the summer rainy season has begun in the southwest. Thunderstorms are seen in the Mojave desert in Nevada, Arizona and New Mexico. They often produce more bluster than rain although when dewpoints rise, heavy rains and local flooding has occurred near the stronger storms. Lightning may trigger fires when the storms are dry and Haboobs or dust storms can be produced when the outflow winds are strong as in early July 2011 in Phoenix.
Final thought. What is the probability given all these problems and those we chronicled in this working document a few years back with Michael Smith we can pretend we can sense global climate change to a tenth of a degree????