


As one might expect from a UN inspired report, especially one with such a weak team of Lead Authors, this one will set a new record for these reports for bad science. the key findings often do not reflect the material continued within much as was the case with the UN reports and prior government sponsored reports.
There are a few early responses.
2016 National Climate Assessment, a Self Falsifying Prophecy
Guest post by David Middleton on WUWT
There has been some recent “buzz” about the upcoming Fourth National Climate Assessment (NC4), including some moonbat conspiracy theories that the Trump administration will try to suppress or otherwise interfere with the scientific integrity of the report. The New York Times has already been forced to essentially retract such a claim in a recent article.
If NC4 actually builds upon 2014’s NC3, EPA Administrator Pruitt’s Red Team will have even more material to work with.
Fourth National Climate Assessment
Development of the Fourth National Climate Assessment (NCA4) is currently underway, with anticipated delivery in late 2018. Below you will find information related to NCA4, including a list of chapters, explanation of author roles, and opportunities to participate in the process.
NCA4 will build upon the successes of the Third National Climate Assessment. Find out more:
LEARN MORE
“NCA4 will build upon the successes of the Third National Climate Assessment"… What success?
Here’s a link to the NCA3 overview.
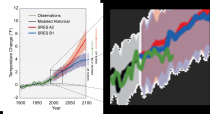
The first “sciencey” graphic is titled: Projected Global Temperature Change.
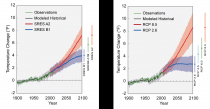
And then just enlarged the Epic Failure bits to get the Red Team’s QED:
----------------
Then there is Tony Heller’s attack on the temperature claims.
Very High Confidence Of Fraud In The National Climate Assessment
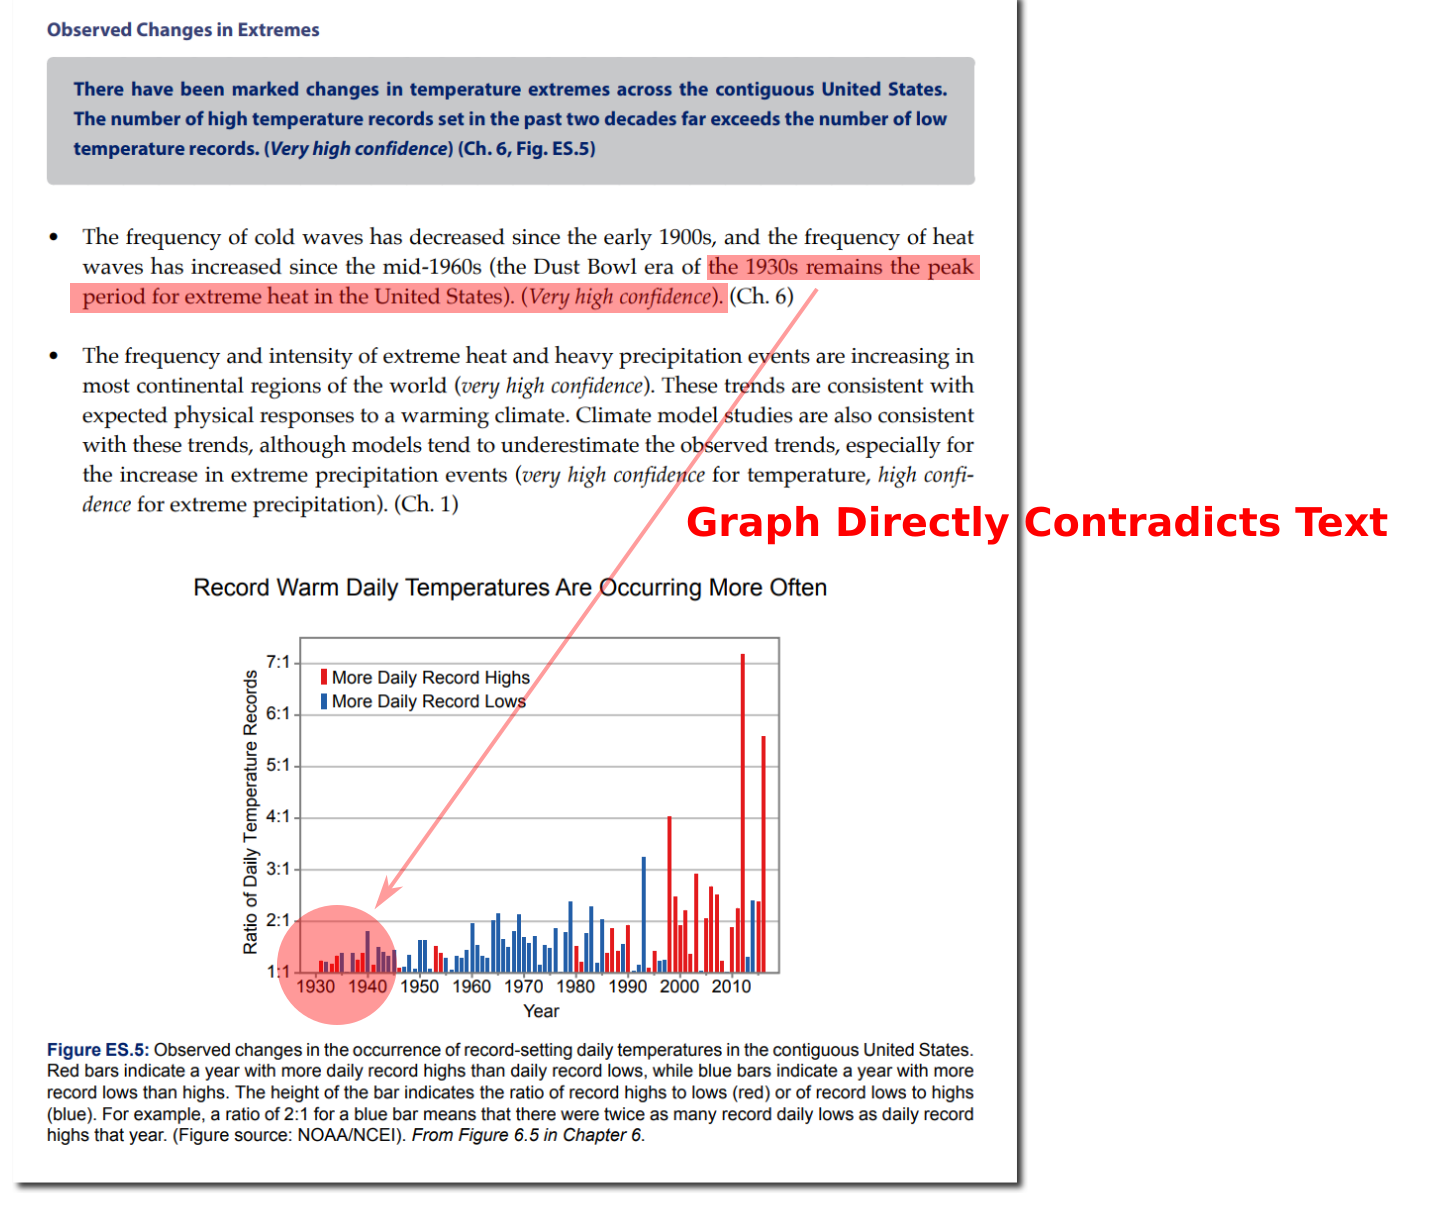
Katharine Hayhoe and her partners in crime have officially released their National Climate Assessment, which includes this graph, which claims “Record Warm Daily Temperatures Are Occurring More Often”.
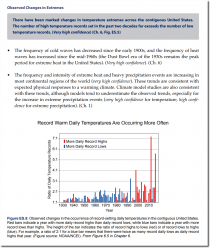
The first thing I noticed is that the text in the report does not match the graph. They say :
The Dust Bowl era of the 1930s remains the peak period for extreme heat in the United States
Yet the graph right below it does not show the 1930’s as being hot.
_thumb.png)
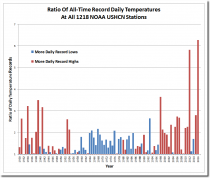
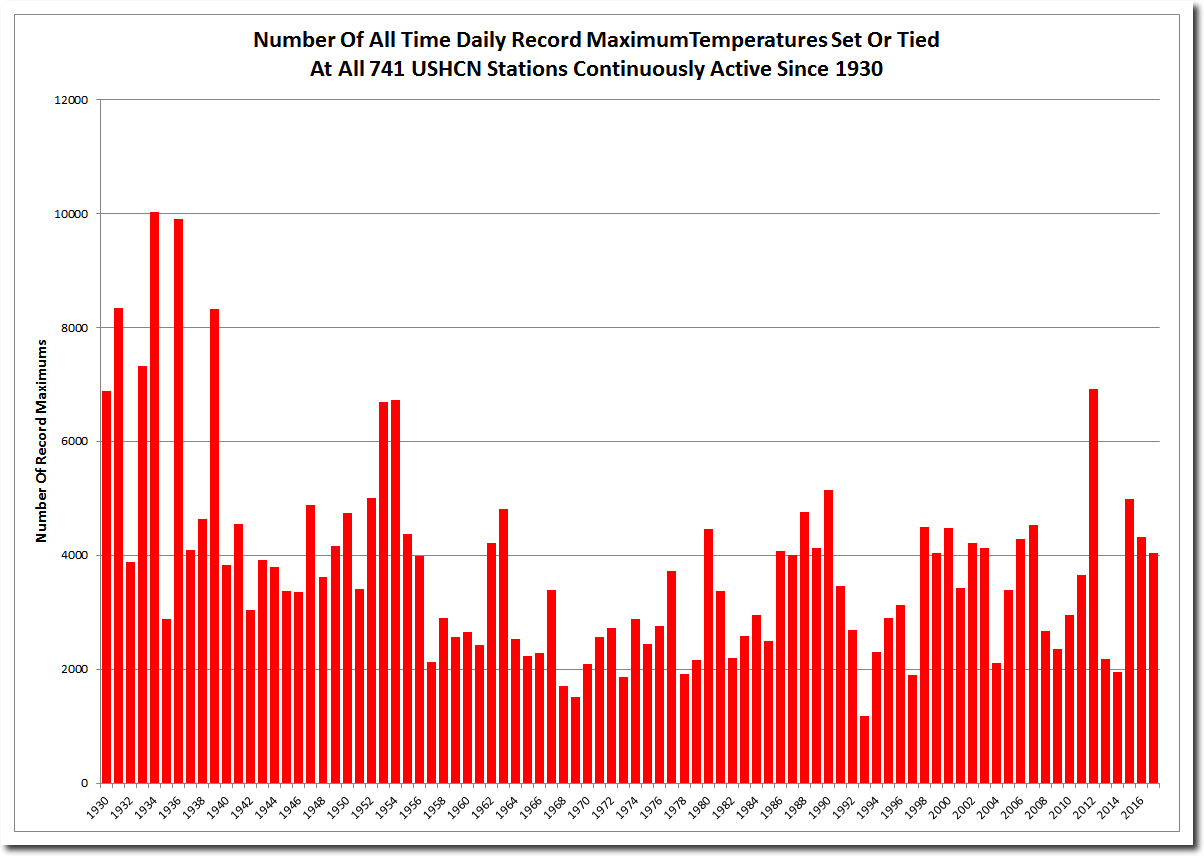
Unfortunately for Katharine and her band of climate fraudsters, I have software which does this calculation. The graph below is the correct version. Their graph is more or less correct after 1970 - but the pre-1970 data is completely fraudulent. They removed all of the hot weather from 1930 to 1954. NOAA does not make adjustments to daily temperatures, so they can’t use that excuse.
The report claims :
Record Warm Daily Temperatures Are Occurring More Often
That is an outright lie. Record warm daily maximum temperatures have decreased sharply since 1930 - the start date of their graph.
_thumb.png)
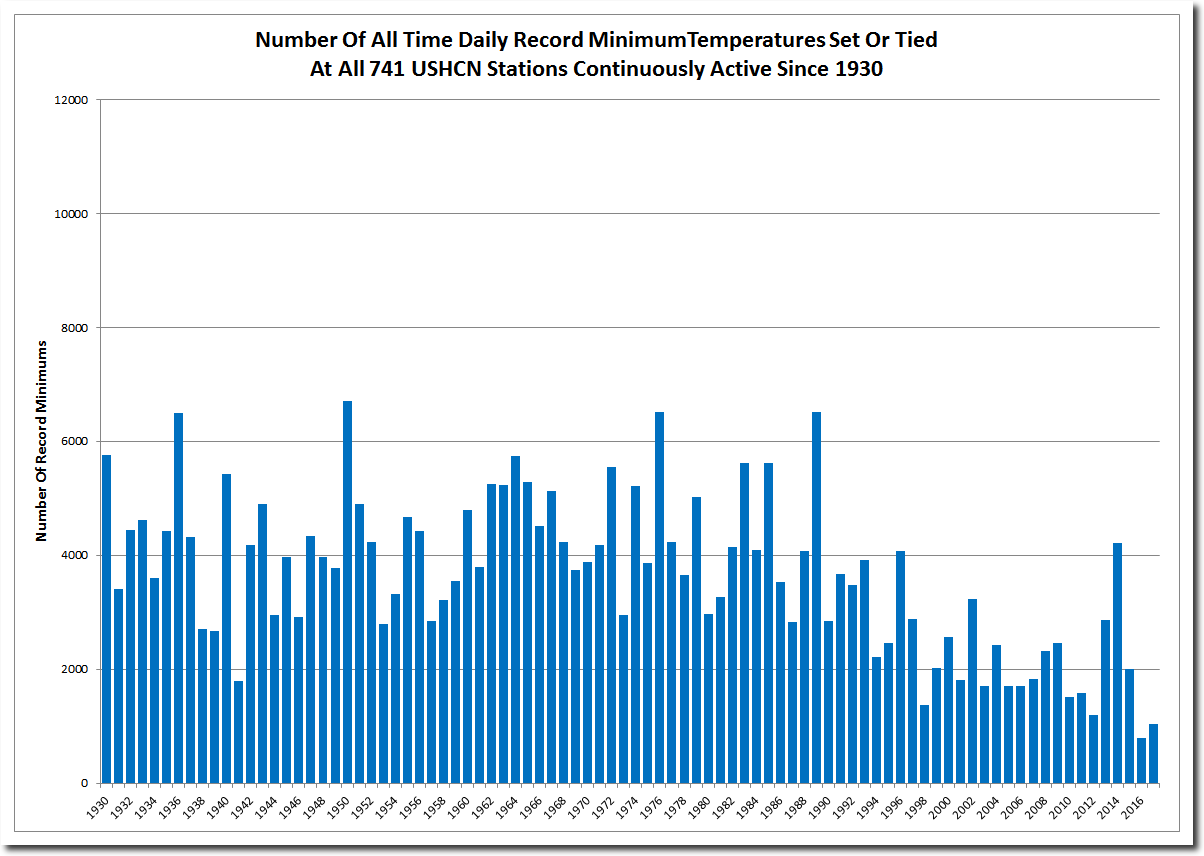
The number of record daily minimums has also decreased.
_thumb.png)
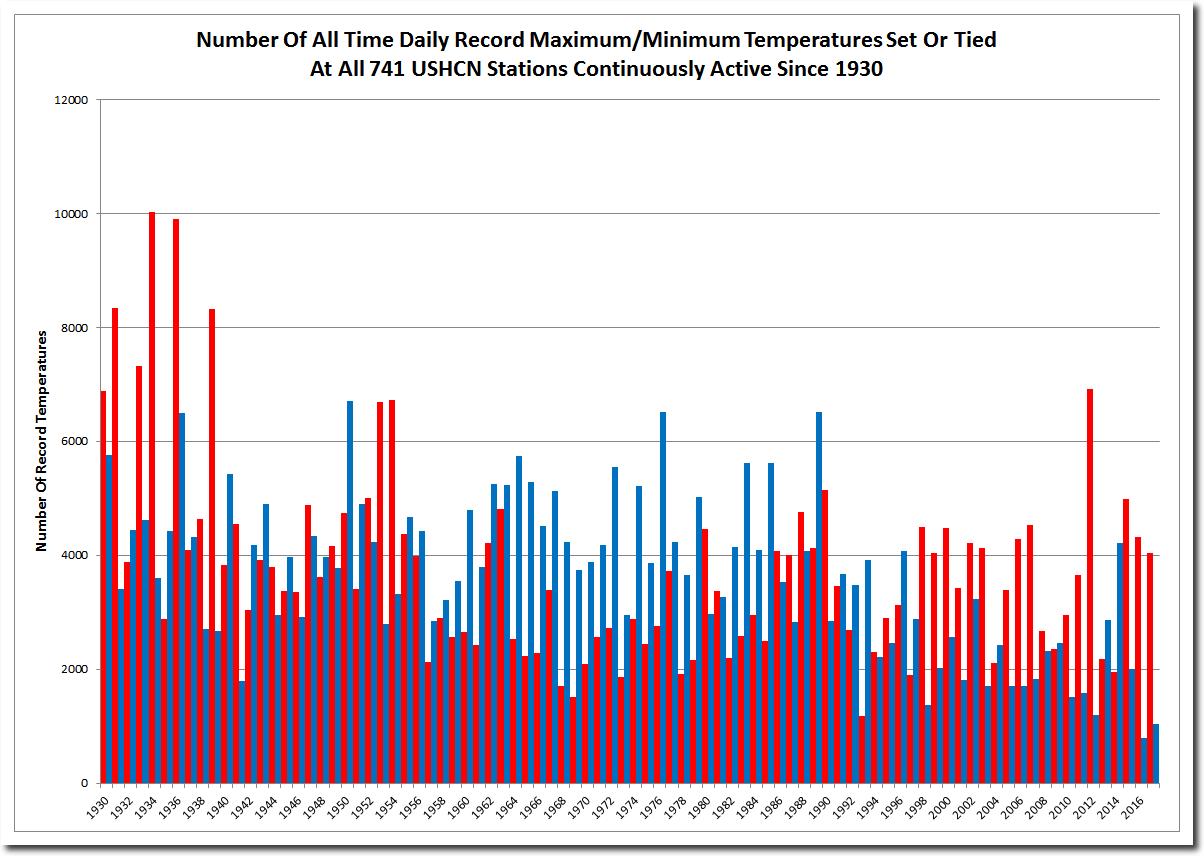
The US climate is getting milder, with fewer very hot or very cold days.
_thumb.png)
So why the big spikes in 2012 and 2016?
_thumb.png)
This is a classic divide by zero error. Ratios become unstable when the denominator becomes small. The numbers are meaningless. No serious scientist would release a wildly flawed and dishonest graph like Katharine Hayhoe does on a consistent basis.
See Tonys video:
See one more detailed assessment by Judith Curry.