


By MICHAEL SUNUNU Union Leader Opinion
Climate alarmists appear to be getting desperate. For three decades, they have been forecasting the end of days, yet Mother Nature hasn’t cooperated. We were told Arctic ice would be gone by now. It isn’t. We were told our children wouldn’t experience snowfalls. They will. We were told hurricanes would ravage our coastlines. It’s been 10 years since a major hurricane made landfall in the U.S.
Now the bogeyman is sea level rise. Claims of accelerated sea level rise are all fear and little fact. Professed climate expert Dr. Cameron Wake recently declared homes along the water in Portsmouth were in such danger that their owners should sell now. He stated we could see sea level rise six feet over the next 80 years. “I don’t mean to be hyperbolic here, but that’s the picture,” Wake stated.
Yes, the Earth is warming. It has been warming since the end of the Little Ice Age in the mid-1800s. There have been periods of cooling, warming, and relatively flat temperatures. The trend has been slowly increasing temperatures, but that is what Mother Nature has been doing for almost 200 years. Sea level has also been rising. Again, records show it has been rising for 200 years.
Any intelligent review of climate data - temperature data, sea level data, hurricane data, global sea ice data, drought data, snow cover data, etc. - shows very little change in long-term trends and no acceleration or rapid changes that can be associated with carbon dioxide levels.
And that is why statements such as Dr. Wake’s are irresponsible.
Looking specifically at sea level rise, there is substantial evidence to refute the outrageous claims made by alarmists. For several hundred years global sea level has risen about 1.5 to 2.5 mm per year +/- 0.5 mm. This is a change of 6-10 inches over a century, not even close to Dr. Wake’s fear mongering of six feet. More importantly, there has been no change in that long-term trend. The Wismar, Germany, record is one of the longest and most complete records of sea level rise in the world. It not only shows a long-term trend of 1.4 mm/year, but it shows no change in that trend (no acceleration over the past 50 years) since carbon dioxide levels have gone from 325 to 400 parts per million.
Long-term records from the Netherlands, Hawaii, Sydney, San Francisco, Panama, Trieste and all around the globe covering almost every major body of water show different rates of sea level rise but no changes in the long-term trends. The different rates of change are partly due to the raw data not accounting for glacial isostatic adjustment (the changes in land and sea floor “height” since the glaciers retreated 10,000 years ago), insolation and other regional factors. More importantly, the long term hasn’t changed in more than 100 years. We are not seeing accelerated sea level rise.
Here in New Hampshire, the Seavey Island (Piscataqua) sea level data go back to 1921 with a few brief breaks in the record. That data show that over the last 90 years, sea level in the Portsmouth area has gone up approximately 100 mm. Since the late 1960s, sea level in Portsmouth has basically been flat.
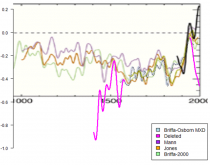
The Permanent Service for Mean Sea Level in Liverpool, England, has been compiling sea level records since 1933. It is not the only global data set for sea level, but it is comprehensive and has a substantial number of long dated data sets. You can browse the data yourself and see how the alarmists fear mongering about sea level is not justified.
In reality, the alarmists such as Dr. Wake do not have a good understanding of our climate. No one does. We don’t fully understand how the sun impacts our climate. We do not understand what causes El Ninos to form and fade. We don’t understand how the atmosphere and our oceans interact. We don’t even understand how cloud formation works and what drives it. That lack of understanding doesn’t appear to have stopped the alarmists from peddling their fears. But their claims cannot stand up to scrutiny anymore. The facts are damning.
Michael Sununu is a consultant in Exeter who has been writing about climate change issues for the past 15 years.
-----------
Tracking climate change? Use the daily highs
HUNTSVILLE, Ala. (April 29, 2016)—Scientists using long-term surface temperature data to track climate change caused by greenhouse gases would be best served using only daily high temperature readings without the nighttime lows, according to new research at The University of Alabama in Huntsville.
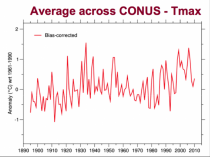
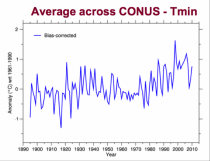
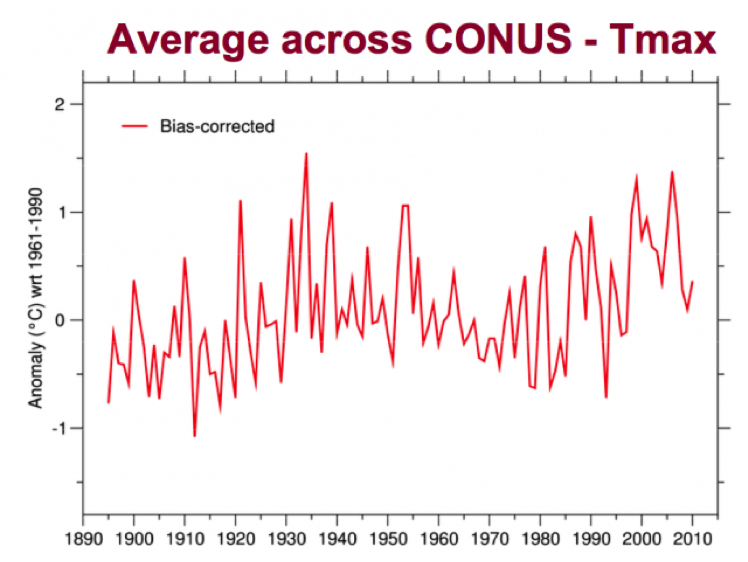
Using temperature data from Alabama going back to 1883, scientists in UAH’s Earth System Science Center developed and tested various methods for creating stable, reliable long-term climate datasets for three portions of inland Alabama.
In addition to creating some arcane mathematical tools useful for creating climate datasets, the team also found daytime high temperature data is less likely to be contaminated by surface issues - such as deforestation, construction, paving and irrigation - than nighttime low temperatures.
“If you change the surface, say if you add buildings or warmer asphalt, you can enhance night time mixing of the lower atmosphere,” said John Christy, the ESSC director and a distinguished professor of atmospheric science at UAH. “That creates a warming caused by vertical mixing rather than changes in greenhouse gases.”
Summer high temperatures are particularly useful in this regard, because summer temperatures tend to be more stable, while cold season temperatures are subject to larger swings due to natural variability. These often wild swings in temperature introduce “noise” into the data, which can mask long-term trends and their causes.
Results of this research were published recently in the American Meteorological Society’s “Journal of Applied Meteorology and Climatology.”
Basically, under pristine natural conditions, in most places a cool layer of air forms close to the ground after the sun sets. This layer of denser, cooler air creates a boundary layer that keeps out warmer air in the deep layer of the atmosphere above it.
Then people move in. People tend to do all sorts of things that mess with the local climate. Breezes blowing around buildings can cause nighttime turbulence, breaking apart the cool boundary layer. Streets, parking lots and rooftops absorb heat during the day and release it into the atmosphere at night, also causing turbulence. Irrigation increases dry soil’s ability to hold heat and releases a powerful greenhouse gas (water vapor) into the lowest levels of the atmosphere over dry and desert areas.
That’s the short list.
When the cool layer of air near the surface is disturbed, warmer air aloft is drawn down to the surface.
All of those cause real changes in the local climate, raising local surface temperatures, especially at night, by amounts large enough to be noticed both by weather station thermometers and by people living in some of those areas.
But none of those changes has anything to do with widespread climate change in the deep atmosphere over large areas of the globe, such as might be seen if caused by increased concentrations of carbon dioxide in the atmosphere.
“Over time this might look like warming or an accumulation of heat in the temperature record, but this temperature change is only caused by the redistribution of warmer air that has always been there, just not at the surface,” said Richard McNider, a distinguished professor of science at UAH.
So how can climatologists use existing long-term surface temperature records to accurately track the potential effects of enhanced CO2?
Take the nighttime boundary layer (and all of the things we do to interfere with it) out of play, say Christy and McNider.
“We prefer to take temperature measurements in the deep layer of the atmosphere, which is why we use instruments on satellites,” Christy said. “But the satellite data only goes back to the last few days of 1978. We use the surface record because it is longer, and we really want to look at data that goes back much further than 1978.
“Because of the natural mixing of the atmosphere caused by daytime heating, daily maximum temperatures are the best surface data to use to look at temperatures in the deep atmosphere. At the surface, the daytime maximum temperature just represents more air than the nighttime low.”
The new temperature datasets extend the existing climatology for three regions of interior Alabama (around Montgomery, Birmingham and Huntsville) by a dozen summers, all the way back to 1883. Summers in Alabama have been cooling, especially since 1954. Interior Alabama’s ten coolest summers were after 1960, with most of those after 1990.
As might be expected given that cooling, climate models individually and in groups do a poor job of modeling the state’s long-term temperature and rainfall changes since 1883. The researchers conclude the models - the same models widely used to forecast climate change - show “no skill” in explaining long-term changes since 1883.