


By Joseph D’Aleo, CCM
The now familiar plot of the US climate network since 1895 shows a cyclical pattern with a rise from 1895 to a peak near 1930 and decline into the 1970s and then another rise with an apparent peak around 2000. Note the minor warming from the peak in 1930 to the peak in 2000.
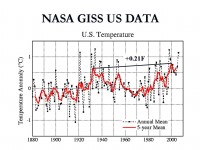
The short term fluctuations are driven by factors such as ENSO and volcanic eruptions. The longer term cycles are mainly driven by cycles in the sun and oceans although changes in the last half century have been increasingly blamed on anthropogenic factors. Let’s look at the three longer term factors mentioned and how well they atcually correlated with the observed temperatures.
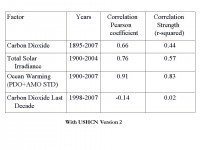
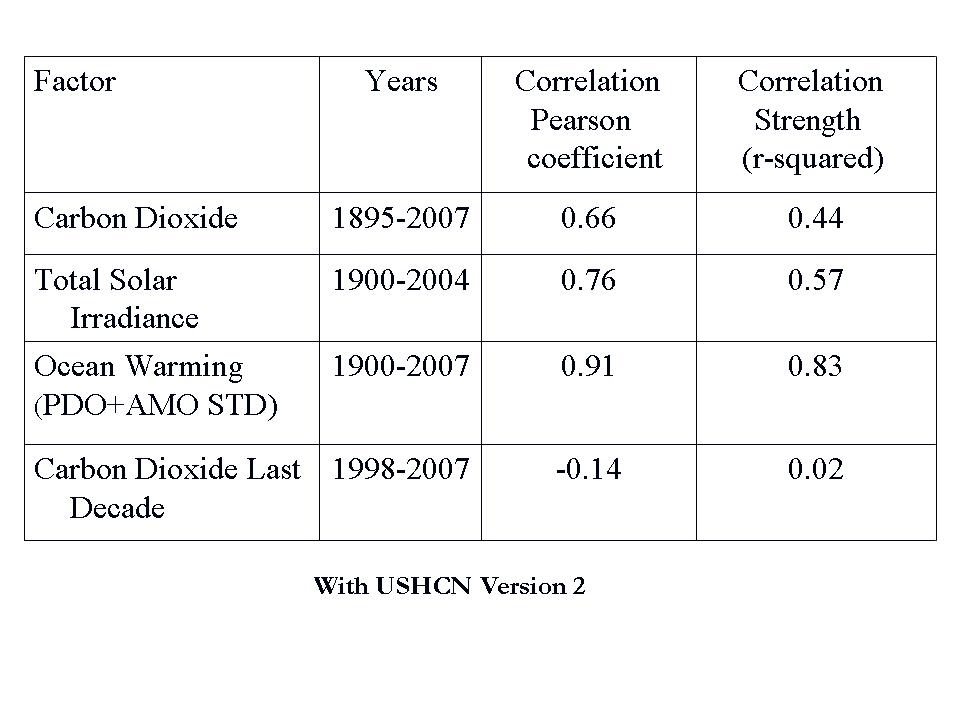
See full size table here.
Clearly the US annul temperatures over the last century have correlated far better with cycles in the sun and oceans than carbon dioxide. Whatsmore, this correlation with carbon dioxide seems to be weakening further in the last decade. Read full details about how this analysis was done here.