


By Anthony Watts
While there’s news of ocean heat content in the Atlantic being pumped up by “leakage” from the Indian Ocean, and NOAA proclaims that La Nina is back, Bob Tisdale finds that the global ocean heat content trend since the turn of the 21st century is flat. Worse than that, it widely diverges from climate models predicting a continued rise in OHC.
2nd Quarter 2011 NODC Global OHC Anomalies
by Bob Tisdale
The NODC updated its Ocean Heat Content Anomaly data to include the 2nd quarter 2011 data. (And they also updated their Thermosteric Sea Level Anomaly data, which is not discussed in this post) I will provide a more detailed discussion as soon as the KNMI Climate Explorer is updated with the 2ndquarter 2011 Ocean Heat Content data, which should be later this month.
THE GRAPHS
Figure 1 is a time-series graph of the NODC Global Ocean Heat Content Anomalies from the start of the dataset (1st Quarter of 1955) to present (2nd Quarter of 2011). The quarterly data for the world oceans is available through the NODC in spreadsheet (.csv ) form (Right Click and Save As: Global OHC Data). While there was a significant increase in Global Ocean Heat Content over the term of the data, Global Ocean Heat Content has flattened in recent years.
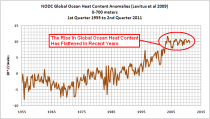
Figure 1 (enlarged)
And as many are aware, Climate Model Projections of Ocean Heat Content anomalies did not anticipate this flattening. Figure 2 compares the ARGO-era (2003 to present) NODC Global Ocean Heat Content anomalies to the GISS Model-E Projection of 0.7*10^22 Joules per year. The linear trend of the observations is approximately 7% of the trend projected by the model mean of the GISS Model-E.
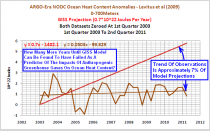
Figure 2 (enlarged)
The source of the 0.7*10^22 Joules per year GISS Model-E ensemble-mean trend was illustrated, clarified, and questioned in the post GISS OHC Model Trends: One Question Answered, Another Uncovered.
HOW MANY MORE YEARS UNTIL GISS MODEL-E CAN BE FOUND TO HAVE FAILED AS A PREDICTOR OF THE IMPACTS OF ANTHROPOGENIC GREENHOUSE GASES ON OCEAN HEAT CONTENT?
I asked the above question in Figure 2. It’s a rewording of the question asked by Roger Pielke Sr., in his post 2011 Update Of The Comparison Of Upper Ocean Heat Content Changes With The GISS Model Predictions. There he notes:
Joules resulting from a positive radiative imbalance must continue to be accumulated in order for global warming to occur. In the last 7 1/2 years there has been an absence of this heating. An important research question is how many more years of this lack of agreement with the GISS model (and other model) predictions must occur before there is wide recognition that the IPCC models have failed as skillful predictions of the effect of the radiative forcing of anthropogenic inputs of greenhouse gases and aerosols.
As far as I’m concerned, they have already failed for numerous reasons. I have illustrated and discussed in past posts how:
1. ENSO is responsible for much of the rise in Ocean Heat Content for many of the ocean basins,
2. A change in sea level pressure is likely the cause of the upward shift in North Pacific Ocean Heat content during the late 1980s,
3. And ENSO, changes in Sea Level Pressure, and the AMO/AMOC are major contributors to the rise in North Atlantic Ocean Heat Content.
And as far as I know, these are natural contributors to the rise that are overlooked by the GISS Model-E. This was further illustrated and discussed in Why Are OHC Observations (0-700m) Diverging From GISS Projections?
NOTES ABOUT THE ARGO-ERA GRAPH
There will be those who will attempt to dismiss the divergence between model projection and observations shown in Figure 2. Tamino tried to downplay the divergence in his post Favorite Denier Tricks, or How to Hide the Incline. I responded to Tamino with my post On Tamino’s Post “Favorite Denier Tricks Or How To Hide The Incline”. And there may be those who believe 2004 is a more appropriate year to use as the start of the ARGO-era OHC data, so for them, I illustrated how little difference it makes whether the ARGO-era starts in 2003 or 2004 in the post ARGO-Era Start Year: 2003 vs 2004. Note that there are two GISS Model-E projections illustrated in the sole graph in the post ARGO-Era Start Year: 2003 vs 2004. The one at 0.98*10^22 Joules per year, identified as Hansen/Pielke Sr., was found to be in error. This was discussed in the post GISS OHC Model Trends: One Question Answered, Another Uncovered.And of course, there is the fact that natural variables, which are not accounted for by the GISS Model-E, are major contributors to rise in Ocean Heat Content, as discussed in the four posts linked in the previous section.
DATASET INTRODUCTION
The NODC OHC dataset is based on the Levitus et al (2009) paper “Global ocean heat content(1955-2008) in light of recent instrumentation problems”, Geophysical Research Letters. Refer to Manuscript. It was revised in 2010 as noted in the October 18, 2010 post Update And Changes To NODC Ocean Heat Content Data. As described in the NODC’s explanation of ocean heat content (OHC) data changes, the changes result from “data additions and data quality control,” from a switch in base climatology, and from revised Expendable Bathythermograph (XBT) bias calculations.
See full post with many hyperlinks here.