


ICECAP NOTE: ICECAP has reached another milestone, exceeding 40 million page hits. THANK YOU.
Thank you for your continued support through donations which help us pay the monthly maintenance and security. You can support our effort through the donation button (small amounts are welcome) or by joining Joe Bastardi, Ryan Maue and I at Weatherbell.com, where we do multiple daily posts and specialized forecasts.
-------------
By Dr. Roy Spencer
April 16th, 2013
Since the slowdown in surface warming over the last 15 years has been a popular topic recently, I thought I would show results for the lower tropospheric temperature (LT) compared to climate models calculated over the same atmospheric layers the satellites sense.
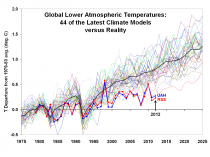
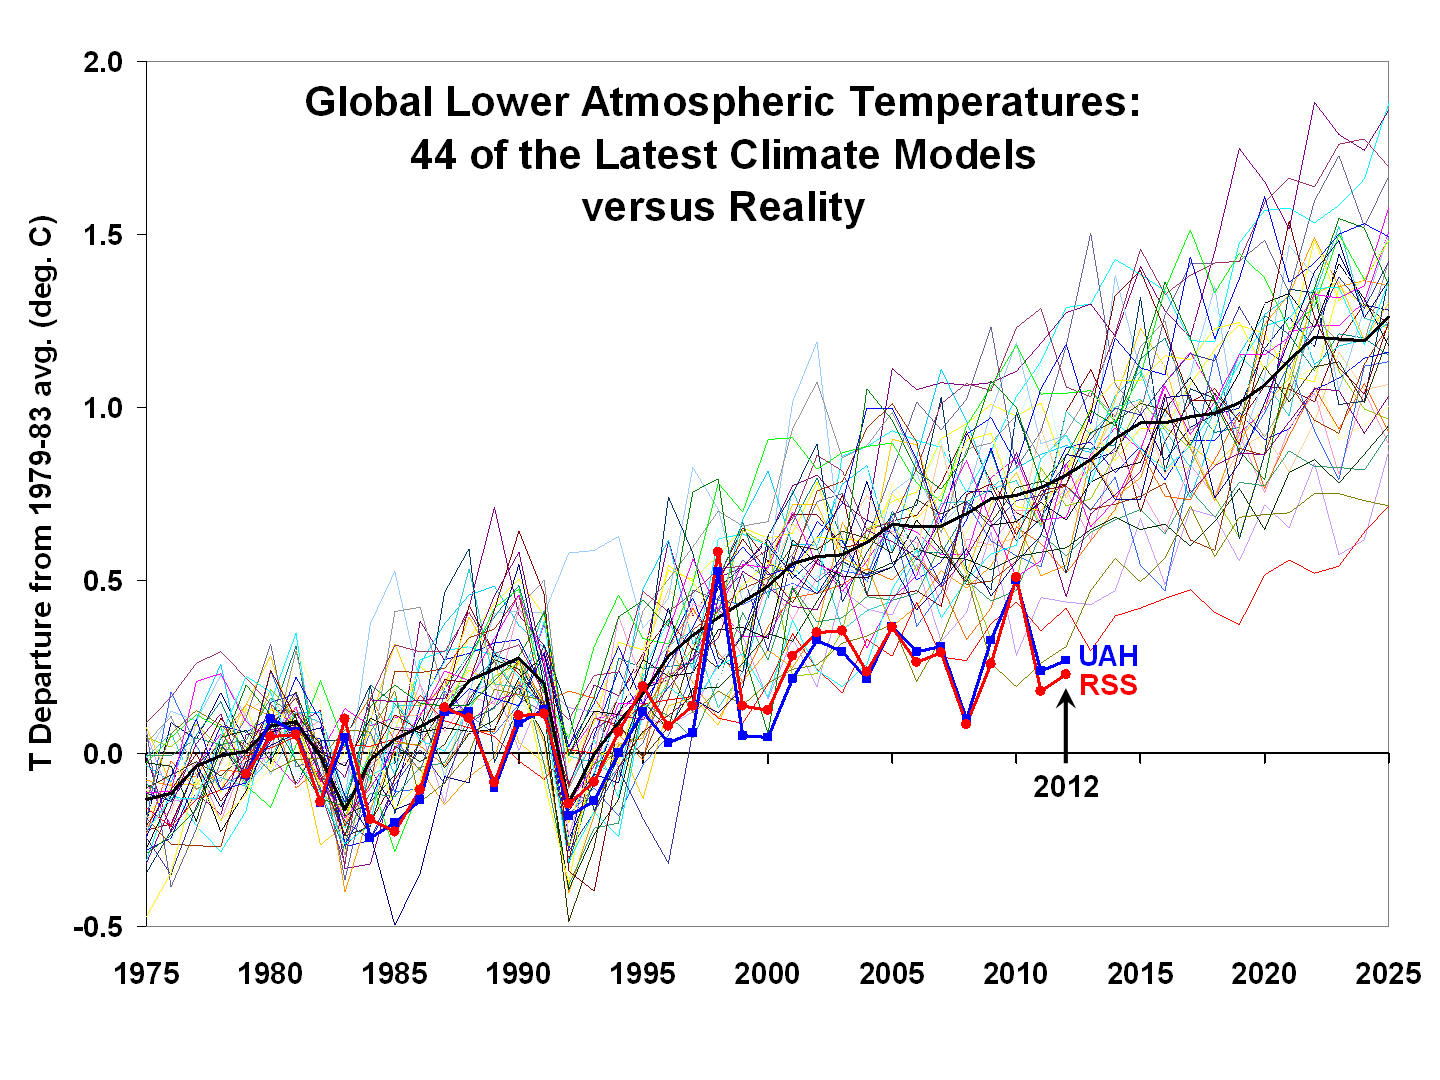
Courtesy of John Christy, and based upon data from the KNMI Climate Explorer, below is a comparison of 44 climate models versus the UAH and RSS satellite observations for global lower tropospheric temperature variations, for the period 1979 to 2012 from the satellites, and for 1975 to 2025 for the models:
Clearly, there is increasing divergence over the years between the satellite observations (UAH, RSS) and the models. The reasons for the disagreement are not obvious, since there are at least a few possibilities:
1) the real climate system is not as sensitive to increasing CO2 as the models are programmed to be (my preferred explanation)
2) the extra surface heating from more CO2 has been diluted more than expected by increased mixing with cooler, deeper ocean waters (Trenberth’s explanation)
3) increased manmade aerosol pollution is causing a cooling influence, partly mitigating the manmade CO2 warming
If I am correct (explanation #1), then we will continue to see little warming into the future. Additional evidence for lower climate sensitivity in the above plot is the observed response to the 1991 Pinatubo eruption: the temporary temperature dip in 1992-93, and subsequent recovery, is weaker in the observations than in the models. This is exactly what would be predicted with lower climate sensitivity.
On the other hand, if Trenberth is correct (explanation #2), then there should be a period of rapid surface warming that resumes at some point, since the climate system must eventually try to achieve radiative energy equilibrium. Of course, exactly when that might be is unknown.
Explanation #3 (anthropogenic aerosol cooling), while theoretically possible, has always seemed like cheating to me since the magnitude of aerosol cooling is so uncertain it can be invoked in any amount desired to explain the observations. Besides, blaming a lack of warming on humans just seems a little bizarre.
The dark line in the above plot is the 44-model average, and it approximately represents what the IPCC uses for its official best estimate of projected warming. Obviously, there is a substantial disconnect between the models and observations for this statistic.
I find it disingenuous for those who claim that, because not ALL of individual the models disagree with the observations, the models are somehow vindicated. What those pundits fail to mention is that the few models which support weaker warming through 2012 are usually those with lower climate sensitivity.
So, if you are going to claim that the observations support some of the models, and least be honest and admit they support the models that are NOT consistent with the IPCC best estimates of warming.
----------
SOLAR INFLUENCE ON GLOBAL TEMPERATURE
Citation: Center for the Study of Carbon Dioxide and Global Change. ”Solar Influence on Global Temperature.” Last modified April 17, 2013
The claim that anthropogenic greenhouse gas emissions have been responsible for the warming detected in the twentieth century is based on what Loehle (2004) calls “the standard assumption in climate research, including the IPCC reports,” that “over a century time interval there is not likely to be any recognizable trend to global temperatures (Risbey et al., 2000), and thus the null model for climate signal detection is a flat temperature trend with some autocorrelated noise,” so that “any warming trends in excess of that expected from normal climatic variability are then assumed to be due to anthropogenic effects.” If, however, there are significant underlying climate trends or cycles-or both-either known or unknown, that assumption is clearly invalid.