


UPDATE: Live Sceince fights back; “NBC NewsClaims global warming stopped 15 years ago are based on “cherry-picked” data and don’t account for natural fluctuations in climate, according to climate scientists responding to an article that appeared Saturday (Oct. 13) in the British newspaper, The Daily Mail...Michael Mann, a climate scientist at Pennsylvania State University, called the latest story “just more dishonest cherry-picking and sleight of hand by Rose” and his go-to sources."This is just one in a continuing series of hit pieces by David Rose in The Daily Mail that completely misrepresents climate science and climate scientists. Global warming hasn’t stopped by any objective measure; it is proceeding right on schedule. In many respects (e.g. the dramatic loss of Arctic sea ice this summer), it is well ahead of schedule,” Mann told LiveScience in an email.
BUT German scientists challenge Mann’s face saving stance.
Luning/Vahrenholt Comment On HadCRUT’s 16 Years Of No Warming: “Tough Times Ahead For Climate Science”
By P Gosselin on 16. Oktober 2012
Although the silence that has spread over the mainstream media and “climate community” has been deafening, skeptic blogs on the other hand have been stepping in earnestly to inform the public on what the climate is really doing. The blogosphere has been ablaze over the last few days.
In Germany the media has been dead silent on the news that warming has stopped. There’s a simple reason for that: In Europe, good news is bad news.
Sebastian Luning and Fritz Vahrenholt have published their take on the official HadCRUT confirmation that there’s been no warming since even before Michael Mann’s infamous hockey stick fabrication was first released.
===================
New HadCRUT data confirm: global temperature has not risen in 16 years
By Dr. Sebastian Luning and Prof. Fritz Vahrenholt
(Translation/editing: Pierre Gosselin)
In the IPCC climate models, there’s only one direction projected for the future development of global temperature, namely a steady and strong increase. Also Stefan Rahmstorf of the Potsdam Institute for Climate Impact Research (PIK) shared this conviction and declared just last year in November 2011 in the Neuen Osnabrucker Zeitung:
“Global warming is galloping ahead unhindered. The temperature is increasing at a rate of between 0.16 and 0.18 C per decade.”
However, the quality of projections have to be tested using the hard data of reality. One of the most important datasets comes from the Hadley Centre of the British Met Office in cooperation with the Climate Research Unit (CRU) of the University of East Anglia. While the Hadley Centre is responsible for the sea surface temperatures, the CRU takes care of the land temperatures. Together they form the so-called HadCRUT dataset.
Recently the newest HadCRUT numbers were released; they extended up to August 2012. It turns out that everything that had been suspected was confirmed: The global temperature hasn’t risen in 16 years (see Figure below). This is a completely unexpected development when one considers how all the boldly confident forecasts from the IPCC predicted more warming.
The release of the new HadCRUT figures occurred almost in absolute silence, without any media buzz whatsoever. With some hesitation the British Daily Mail took up the topic and reported on the extension of the unhoped for temperature plateau. The report also questioned Phil Jones, the current Director of the Climate Research Unit. He confirmed the plateau and even considered it possible that it will extend even more, but only if the an El Nino does not form in the Pacific over the coming months. An El Nino would cause global temperatures to spike upwards for a short time. On the deviation between the the IPCC models and measured temperatures, Jones says:
We don’t fully understand how to input things like changes in the oceans, and because we don’t fully understand it you could say that natural variability is now working to suppress the warming. We don’t know what natural variability is doing.”
In 2009. Phil Jones had informed a colleague by e-mail that he would be concerned about the quality of the IPCC climate models if the stop in warming continued beyond 15 years. That e-mail was made public by the Climategate scandal, when an unknown hacker had breached the servers of the Climate Research Unit. The 15-year period named in that e-mail has in the meantime been surpassed. One really has got to wonder that Jones has suddenly extended his personal threshold of pain to 20 years, and now claims that phases of no warming 15-16 years long had always been expected.
Climate scientist Judith Curry, Director of Earth and Climate Sciences at Georgia Tech University, takes a more sober view. In the same Daily Mail article she says:
The new data confirms the existence of a pause in global warming. [...] Climate models are very complex, but they are imperfect and incomplete. Natural variability [the impact of factors such as long-term temperature cycles in the oceans and the output of the sun] has been shown over the past two decades to have a magnitude that dominates the greenhouse warming effect. It is becoming increasingly apparent that our attribution of warming since 1980 and future projections of climate change needs to consider natural internal variability as a factor of fundamental importance.”
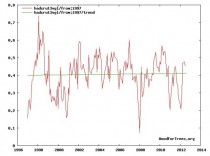
Figure 1: HadCRUT temperature data 1997 until today (red curve). The trend line (green) shows no significant increase. This temperature plateau has now been going on over 16 years. Source: Real Science based on woodfortrees.
Also Stefan Rahmstorf now appears to be worried and is desperately hoping for a trend change. Finally for 2013 he sees a new temperature record in the making; one that will hopefully break the old 1998 record. In the magazine Spektrum der Wissenschaft (also see New Scientist) Rahmstorf wrote in September 2012:
In the meantime the solar cycle is again on the rebound, and it is only a question of time before the next El Nino episode kicks in. The US NOAA has even forecast that this will occur this fall. Both of these factors together with the continuing rising greenhouse gases make it indeed probable that already 2013 could be a record year. Maybe this will mute the unscientific voices who again and again falsely claim that global warming is over.”
However, clicking on Rahmstorf’s El Nino link brings his readers back to sobriety. The acute NOAA El Nino warning has since been withdrawn and now more or less “neutral conditions” are being forecast for the northern winter of 2012/2013 in the tropical Pacific.
It’s also interesting that Rahmstorf suddenly is now increasingly emphasizing the sun, though the sun matters more for the long-term over years to decades. Speaking of solar activity, things with the upcoming solar maximum in the Spring of 2013 don’t appear to be cooperating either. The value will be considerably below the past cycles, which will tend to have more of a cooling effect than one of warming. Moreover some experts are already warning that the solar maximum of the current cycle may already be behind us(see our blog article: “Have we already missed the maximum of the current solar cycle? Asymmetry of the sun signals an extended period of low activity"). It’s quite possible that hard times lie ahead for climate science…
---------------
Global warming stopped 16 years ago, reveals Met Office report quietly released....and here is the chart to prove it
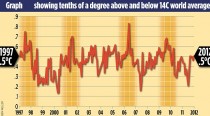
The figures reveal that from the beginning of 1997 until August 2012 there was no discernible rise in aggregate global temperatures
This means that the ‘pause’ in global warming has now lasted for about the same time as the previous period when temperatures rose, 1980 to 1996
By David Rose
The world stopped getting warmer almost 16 years ago, according to new ( non-satellite BB) data released last week.
The figures, which have triggered debate among climate scientists, reveal that from the beginning of 1997 until August 2012, there was no discernible rise in aggregate global temperatures.
This means that the ‘plateau’ or ‘pause’ in global warming has now lasted for about the same time as the previous period when temperatures rose, 1980 to 1996. Before that, temperatures had been stable or declining for about 40 years.
The new data, compiled from more than 3,000 measuring points on land and sea, was issued quietly on the internet, without any media fanfare, and, until today, it has not been reported.
This stands in sharp contrast to the release of the previous figures six months ago, which went only to the end of 2010 a very warm year.
Ending the data then means it is possible to show a slight warming trend since 1997, but 2011 and the first eight months of 2012 were much cooler, and thus this trend is erased.
Some climate scientists, such as Professor Phil Jones, director of the Climatic Research Unit at the University of East Anglia, last week dismissed the significance of the plateau, saying that 15 or 16 years is too short a period from which to draw conclusions.
Others disagreed. Professor Judith Curry, who is the head of the climate science department at America’s prestigious Georgia Tech university, told The Mail on Sunday that it was clear that the computer models used to predict future warming were ‘deeply flawed’.
Even Prof Jones admitted that he and his colleagues did not understand the impact of ‘natural variability’ - factors such as long-term ocean temperature cycles and changes in the output of the sun. However, he said he was still convinced that the current decade would end up significantly warmer than the previous two.
The regular data collected on global temperature is called Hadcrut 4, as it is jointly issued by the Met Office’s Hadley Centre and Prof Jones’s Climatic Research Unit.
Since 1880, when worldwide industrialisation began to gather pace and reliable statistics were first collected on a global scale, the world has warmed by 0.75 degrees Celsius.
Some scientists have claimed that this rate of warming is set to increase hugely without drastic cuts to carbon-dioxide emissions, predicting a catastrophic increase of up to a further five degrees Celsius by the end of the century.
The new figures were released as the Government made clear that it would ‘bend’ its own carbon-dioxide rules and build new power stations to try to combat the threat of blackouts.
At last week’s Conservative Party Conference, the new Energy Minister, John Hayes, promised that ‘the high-flown theories of bourgeois left-wing academics will not override the interests of ordinary people who need fuel for heat, light and transport energy policies, you might say, for the many, not the few’ - a pledge that has triggered fury from green activists, who fear reductions in the huge subsidies given to wind-turbine firms.
Flawed science costs us dearly
Here are three not-so trivial questions you probably won’t find in your next pub quiz. First, how much warmer has the world become since a) 1880 and b) the beginning of 1997? And what has this got to do with your ever-increasing energy bill?
You may find the answers to the first two surprising. Since 1880, when reliable temperature records began to be kept across most of the globe, the world has warmed by about 0.75 degrees Celsius.
From the start of 1997 until August 2012, however, figures released last week show the answer is zero: the trend, derived from the aggregate data collected from more than 3,000 worldwide measuring points, has been flat.
Not that there has been any coverage in the media, which usually reports climate issues assiduously, since the figures were quietly release online with no accompanying press release - unlike six months ago when they showed a slight warming trend.
The answer to the third question is perhaps the most familiar. Your bills are going up, at least in part, because of the array of ‘green’ subsidies being provided to the renewable energy industry, chiefly wind.
They will cost the average household about 100 pounds this year. This is set to rise steadily higher - yet it is being imposed for only one reason: the widespread conviction, which is shared by politicians of all stripes and drilled into children at primary schools, that, without drastic action to reduce carbon-dioxide emissions, global warming is certain soon to accelerate, with truly catastrophic consequences by the end of the century - when temperatures could be up to five degrees higher.
Hence the significance of those first two answers. Global industrialisation over the past 130 years has made relatively little difference.
And with the country committed by Act of Parliament to reducing CO2 by 80 per cent by 2050, a project that will cost hundreds of billions, the news that the world has got no warmer for the past 16 years comes as something of a shock.
It poses a fundamental challenge to the assumptions underlying every aspect of energy and climate change policy.
This ‘plateau’ in rising temperatures does not mean that global warming won’t at some point resume.
But according to increasing numbers of serious climate scientists, it does suggest that the computer models that have for years been predicting imminent doom, such as those used by the Met Office and the UN Intergovernmental Panel on Climate Change, are flawed, and that the climate is far more complex than the models assert.
‘The new data confirms the existence of a pause in global warming,’ Professor Judith Curry, chair of the School of Earth and Atmospheric Science at America’s Georgia Tech university, told me yesterday.
‘’Climate models are very complex, but they are imperfect and incomplete. Natural variability [the impact of factors such as long-term temperature cycles in the oceans and the output of the sun] has been shown over the past two decades to have a magnitude that dominates the greenhouse warming effect.
‘It is becoming increasingly apparent that our attribution of warming since 1980 and future projections of climate change needs to consider natural internal variability as a factor of fundamental importance.’
Professor Phil Jones, director of the Climate Research Unit at the University of East Anglia, who found himself at the centre of the ‘Climategate’ scandal over leaked emails three years ago, would not normally be expected to agree with her. Yet on two important points, he did.
The data does suggest a plateau, he admitted, and without a major El Nino event - the sudden, dramatic warming of the southern Pacific which takes place unpredictably and always has a huge effect on global weather - ‘it could go on for a while’.
Like Prof Curry, Prof Jones also admitted that the climate models were imperfect: ‘We don’t fully understand how to input things like changes in the oceans, and because we don’t fully understand it you could say that natural variability is now working to suppress the warming. We don’t know what natural variability is doing.’
Yet he insisted that 15 or 16 years is not a significant period: pauses of such length had always been expected, he said.
Yet in 2009, when the plateau was already becoming apparent and being discussed by scientists, he told a colleague in one of the Climategate emails: ‘Bottom line: the “no upward trend” has to continue for a total of 15 years before we get worried.’
But although that point has now been passed, he said that he hadn’t changed his mind about the models’ gloomy predictions: ‘I still think that the current decade which began in 2010 will be warmer by about 0.17 degrees than the previous one, which was warmer than the Nineties.’
Only if that did not happen would he seriously begin to wonder whether something more profound might be happening. In other words, though five years ago he seemed to be saying that 15 years without warming would make him ‘worried’, that period has now become 20 years.
Meanwhile, his Met Office colleagues were sticking to their guns. A spokesman said: ‘Choosing a starting or end point on short-term scales can be very misleading. Climate change can only be detected from multi-decadal timescales due to the inherent variability in the climate system.’
He said that for the plateau to last any more than 15 years was ‘unlikely’. Asked about a prediction that the Met Office made in 2009 - that three of the ensuing five years would set a new world temperature record - he made no comment. With no sign of a strong El Nino next year, the prospects of this happening are remote.
Why all this matters should be obvious. Every quarter, statistics on the economy’s output and models of future performance have a huge impact on our lives. They trigger a range of policy responses from the Bank of England and the Treasury, and myriad decisions by private businesses.
Yet it has steadily become apparent since the 2008 crash that both the statistics and the modelling are extremely unreliable. To plan the future around them makes about as much sense as choosing a wedding date three months’ hence on the basis of a long-term weather forecast.
Few people would be so foolish. But decisions of far deeper and more costly significance than those derived from output figures have been and are still being made on the basis of climate predictions, not of the next three months but of the coming century - and this despite the fact that Phil Jones and his colleagues now admit they do not understand the role of ‘natural variability’.
The most depressing feature of this debate is that anyone who questions the alarmist, doomsday scenario will automatically be labelled a climate change ‘denier’, and accused of jeopardising the future of humanity.
So let’s be clear. Yes: global warming is real, and some of it at least has been caused by the CO2 emitted by fossil fuels. But the evidence is beginning to suggest that it may be happening much slower than the catastrophists have claimed a conclusion with enormous policy implications. More.
HADCRUT4 and Met Office Claims
UPDATE
Read this article: Met Office reply to David Rose Sunday Mail article:
“As we’ve stressed before, choosing a starting or end point on short-term scales can be very misleading. Climate change can only be detected from multi-decadal timescales due to the inherent variability in the climate system. If you use a longer period from HadCRUT4 the trend looks very different. For example, 1979 to 2011 shows 0.16C/decade (or 0.15C/decade in the NCDC dataset, 0.16C/decade in GISS). Looking at successive decades over this period, each decade was warmer than the previous so the 1990s were warmer than the 1980s, and the 2000s were warmer than both.”
Ok, let’s look at a non-arbitrary endpoint (the last datapoint) and go back in 5 year increments.
HADCRUT4 Last 5 years colder than previous 5 years
Mean of the anomaly of the last 5 years = .45C
Mean of the anomaly of the previous 5 years = .49C
Mean of the anomaly of the previous previous 5 years = .41C
HADCRUT3 Last 5 years colder than previous AND colder than the previous previous 5.
Mean of the anomaly of the last 5 years = .39C
Mean of the anomaly of the previous 5 years = .45C
Mean of the anomaly of the previous previous 5 years = .41C
Warming stopped. HADCRUT3 trend is negative.
IPCC predicted .2C per decade. HADCRUT4 has been created to change the negative trend of HADCRUT3 to a positive one.
But even with the “adjustments”, the last 15 years trend in HADCRUT4 is 1/6th that predicted by the IPCC.