By Joseph D’Aleo , CCM, AMS Fellow, WeatherBell.com
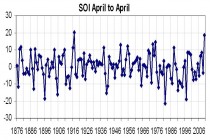
The southern plains drought, followed the second strongest La Nina (behind only 1917/18) according to the Southern Oscillation Index (SOI), an atmospheric pressure based measure (standardized Darwin, Australia versus Tahiti surface pressure). Positive values are La Nina, negative El Ninos. The April to April SOI showed the 1917/18 peak and 2010/11 close behind.
Enlarged.
1917/18 was a very cold winter, coldest La Nina on record. It wasdry in the winter and spring in the south and east. Like this year late in the winter it warmed in the southeast. Summer heat developed in 1918 in early August when Baltimore reached 105F on successive days, The drought in Texas that year ranked neck and neck with 2011. This past winter started out very cold even down to Florida (coldest ever December and January) and ended warm southeast February and March and now the late July heat wave.
----------------
Ironically check out this story on ChristChurch, NZ:Christchurch: second coldest day since 1918
Christchurch cold snap ‘shocker’ - Local News - Star Canterbury
Mrs Griffith said the country was in the middle of what was traditionally the two coldest months of the year but it was rare that Christchurch should experience the second coldest day since 1918.
Dumps of up to 30cm and 15cm were recorded around the city on Monday, with a maximum temperature of 1.9 deg C. It was the second coldest day since -1.2 deg C was recorded at the Botanical Gardens on July 21, 1918.
An event like this happens about once or twice in a century, said Mrs Griffiths.
-------------------
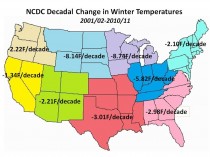
It was unlike 1917/18, very wet in the Ohio and Mid-Mississippi Valley and northwestern plains and Rockies where it left a deep snowpack. It might have been wetter because unlike 1917/18 the US was cooling not warming. The US has been cooling the last decade in winters.
Enlarged.
This cooling has enhanced the snowfall. 20010/11 ranked 3rd snowiest for the Northern Hemisphere behind 1977/78 and 2009/10 and just ahead of 2007/08. The last decade was the snowiest decade on record for the hemisphere as temperatures cooled.
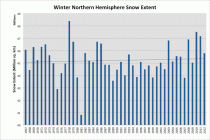
Enlarged.
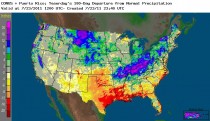
The deep snow in the north and dry warmth in the south enhanced the storm track and produced tornadoes in April and May (with April to big month) and a ton of rain along the Ohio and Mid Mississippi Rivers and also in the north on the Red and later the Missouri River. The flood on the Mississippi was worst since 1927. Many locations in the wet areas had surpluses of over 20 inches while in the dry areas of the south they had deficits exceed 20 inches for the 6 month period.
The Missouri is still in flood.
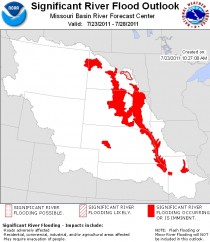
Enlarged.
The heat wave that made the news this week was actually a result of both the dry and moist conditions.
Heat tends to build over drought areas like we saw this year in Texas and Oklahoma. Drought begets drought. Dry air precludes clouds, which allows for more sun which warms even more, a positive feedback. This process often leads to what forecasters call a heat ridge or mound of hot air extending far up into the atmosphere. Like a rock in a stream, much like a blocking high in high latitude it forces systems around it. The heat can get picked up by disturbances around the edges and feed instability and strong thunderstorm complexes. Forecasters refer to this as the ring-of-fire. It has operated for many weeks. Here is a picture of the ring-of-fire on July 8, 2011 as forecast by the GFS model. I could have picked most any day.
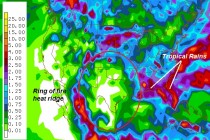
Enlarged.
When dynamic factors like cool air diving south off the west coast where they have a year without a summer has a compensating downstream push north of warm air. This hot air moves over saturated or even flooded fields and lush vegetation. The plants like us humans transpire moisture from their stomata in the leaves (like pores in our skin). This process is an attempt to cool the plant and our body. That process raises the dewpoint (a measure of actual moisture contenjt) in the air. This makes hot temperatures even more uncomfortable.
The NWS has been stressing the heat indices justifiably so just as they do the wind chill in winter because that affects how a person feels. When the air is dry and body or plant is able to easily evaporate moisture, it can stay cooler. To enter the vapor state, the moisture needs heat and extracts it from the evaporating surface- the leaf or you skin. That process can dehyrdate the soil moisture and your body. On a very hot day, soils can lose up to a third of an inch a day. When it is very humid, this mechanism is less effective. Likewise on cold days in winter when the winds blow, they strip away air molecules warmed by contact with your skin and make you feel colder.
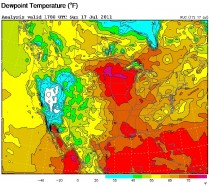
In Morehead, MN, the dewpoint when temperature last week rose to 93F rose to an incredible 87.8F. That made the heat Index 134F, equivalent to the US temperature record set in Death Valley in 1913. But it wasn’t 134F, it just felt that way according at least to this one index. The dewpoint is shown below - purple is over 80F. Some media headlines and cable nitwits said it was 123 or 134F in MN.
This led to elevated nighttime temperatures. In fact 72.5% of the record highs (and 65% of all record temperatures) set the last 8 days were not highest maximum temperature but highest nightttime low temperatures.
How does this translate into the record heat in the east Friday?
Well Friday, that air mass came east. Not only was it warm to begin with but the convection to the west added latent heat to the air as the rising air condensed into clouds and precipitation. When that super warm air aloft got carried east on strong west to northwest winds and subsided downslope from the mountains it warmed even more by compression - about 10F. Sinking and warming cleared out any clouds and haze and enhanced the solar factor. The eastern big cities all get the 100F days when wind are blowing downslope.
In a more typical summer, when the Bermuda high is dominant, the cities suffer the dog days of summer - triple H weather - hot, hazy and humid upper 80s to low 90s. Hot and sticky but not record setting. Often on those days the sea breeze kicks in along the coast as southwest winds turn more southeast from the cooler water. In the strong west to northwest wind case, that sea breeze is shut off. That same heat ridge in the south central has suppressed the Bermuda high by causing downstream trough off the east coast. That explains the many fine days in the east in between the taste of heat in early June and the 3 day heat wave in late July.
Heavy thunderstorms have continued in the ring of fire area this week as the heat eased. Chicago set a record with 6.86 inches of rain at Ohare Saturday. That turned a dry July into the second wettest on record and likely to become the wettest July with more showers expected this week. Only 0.54 inches is needed.


