


By Anthony Watts
One of the surfacestations.org intrepid traveling volunteers, Eric Gamberg, has been traveling through Nebraska as of late, picking up stations as he goes. He recently visited the USHCN station of record in North Loup, NE. Records describe this station as being in a rural area, which is true. Notice all the shadows and the trees? Unlike many stations I’ve pointed out in the past, this station has an uncertain cooling bias from all the shade around it. The bias is variable, with seasons, with tree growth, tree pruning, and with windstorms that may remove leaves or whole branches from the trees. Other angles of this station are visible in the surfacestations.org gallery for this USHCN station.
One of the pictures caught my eye. It was a single picture of a Stevenson Screen at the neighbors location, which also has a significant shading issue with trees around the station. Since it appeared from that description that the station had been moved, I wondered if NOAA had logged the change, so I consulted the NOAA MMS database. The station map showed only two locations as being recorded for this station even though data goes back to 1892 and is used by GISS in their data plots.
I thought maybe I’d try looking at the GISTEMP record to see if I could find any obvious shifts in the data that might provide clues for a relocation. While it might look like there’s a jump coinciding with relocation, other stations in the area, within 100 KM had similar jumps around that time. So it appears the jump was natural, likely due to our rising El Nino year peaking in 1998, or we have another one of those data splicing errors like what was found back in August of 2007.
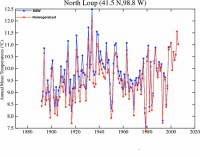
As a final check, I decided to look at the GISS Homogenized data plot for the North Loup station, and here is where the surprise came, the scales of the two graphs didn’t match. There was a .5 degree C difference in the Y scale. The Raw GISS plot topped at 12.5C while the Homogenized GISS plot topped at 12.0C. This was perplexing, so I thought I’d try a data overlay to see what had changed, and what I found was another one of those counter-intuitive downward homogenization adjustments which used the present as a hinge point and made the past cooler:
 \
\
See full size here
So this begs the question: Why is a station that is classified as rural, with an apparent cooling bias due to tree cover, with a long history containing only a few moves, in a small agricultural town with little growth in the last century get an adjustment like this that causes the past to get colder, and create an artificially enhanced positive slope of temperature trend? The nearest “large” city is Grand Island, NE, over 40 miles away. There is nothing but farmland all around North Loup, NE. I don’t care how you try to reason it, an adjustment for a station of this type wouldn’t need to be done for UHI. So what’s going on? Is this another one of those situation where other stations that have UHI that are within a larger radius are affecting this station and forcing an adjustment?
This is why I have trouble trusting GISS data. We keep finding instances like this one where the historical temperature record has been adjusted for no discernible or apparently logical reason. Cedarville, CA, which I previously highlighted is another prime example of a rural station with a long history, little growth, no UHI, but with an artificially enhanced positive temperature trend . This question needs to be answered. See full story here.