


Update: See this YOUTUBE video with Nir Shaviv on solar vs AGW
By Joseph D’Aleo, AMS Fellow, CCM
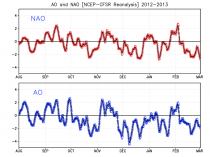
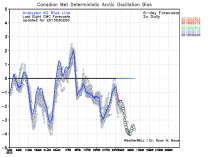
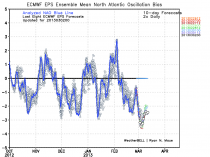
The AO and NAO has been predominantly negative this winter continuing a trend sine the 1990s. It has produced a brutal winter in Russia, especially Siberia into northern and sometimes central China with cold spells and snow in Europe and the United States.
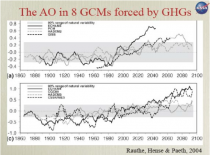
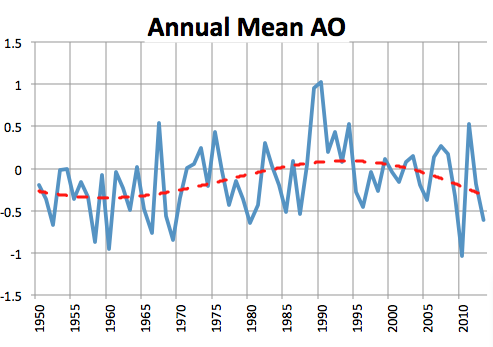
After a rebound last year, we seem to be still on a trend down since 1990. Climate models had indicated an upward trend.

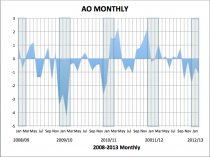
Note how the AO which reached record low levels in 2009/10 winter rebounded late in the 2010/11 winter and stayed higher in 2011/12 before falling again this year.
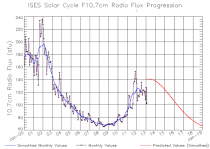
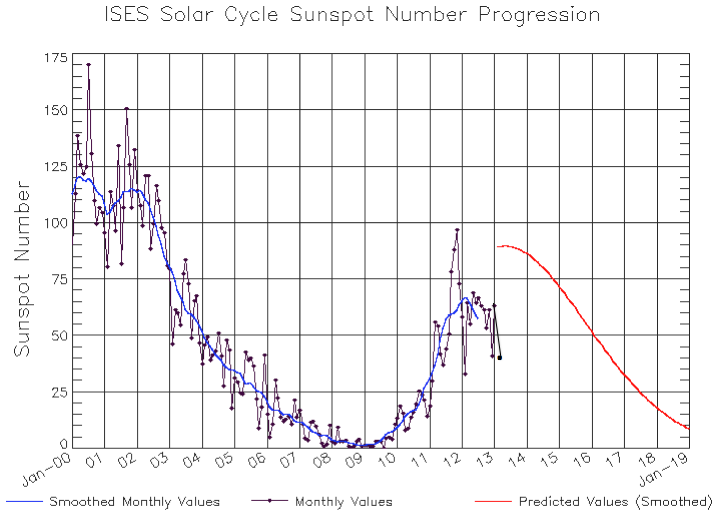
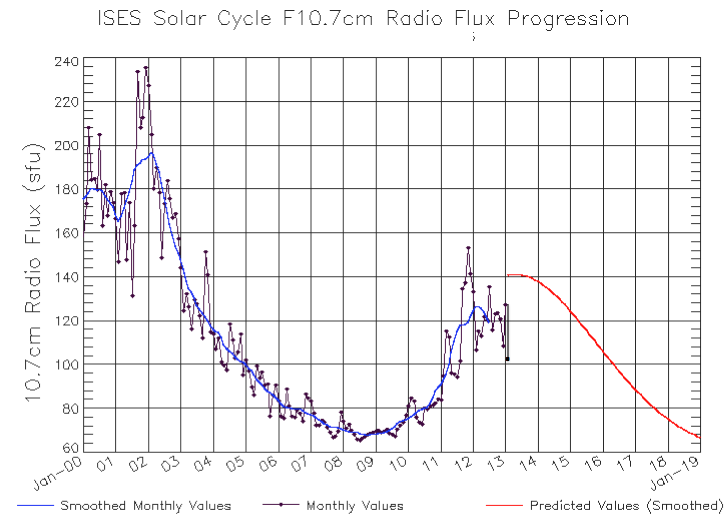
That matches the solar cycle which bottomed out from 2007/08 through 2009/10 before spiking late in 2010/11 and peaking at the start of the 201/12 winter. it has fallen since and February came in with a SSN of just 38, well below the forecast (red).
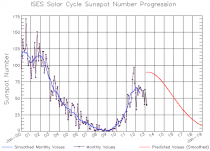
Solar flux too dropped to 104 sfus at a time we are supposed to be near solar max for this cycle.
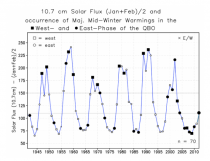
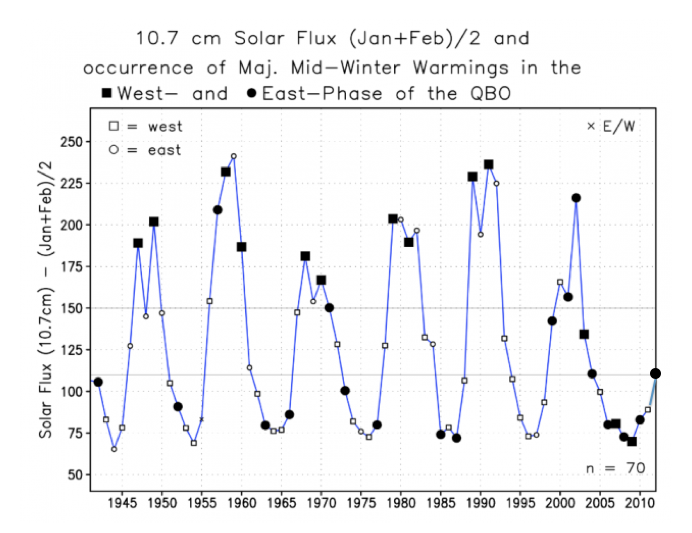
Notice how stratospheric warmings, which produce high latitude blocking and a negative AO and last for 4 to 6 weeks which were rare and mostly near max and min have been almost every years since the sun went ‘asleep’.
The AO and NAO are forecast to stay very low.
NASA SHOWED A CONNECTION OF THE SUN WITH NAO
Shindell et al in the following NASA Earth Observatory story a decade ago related the Maunder Minimum conditions and blocking to the low solar ultraviolet which through ozone chemistry warms the upper atmosphere in low and middle latitudes. When the sun is quiet the UV which changes 6-8% in the 11 year cycle stays near solar minimum levels. The solar flux is said to be a good proxy for the UV.
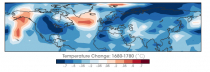
See the temperatures their ozone/UV model showed for the Maunder Minimum versus normal solar times. See the - NAO!!
Here is what they wrote:
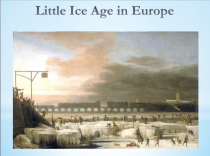
Many things can change temperatures on Earth: a volcano erupts, swathing the Earth with bright haze that blocks sunlight, and temperatures drop; greenhouse gases trap heat in the atmosphere, and temperatures climb. From 1650 to 1710, temperatures across much of the Northern Hemisphere plunged when the Sun entered a quiet phase now called the Maunder Minimum. During this period, very few sunspots appeared on the surface of the Sun, and the overall brightness of the Sun decreased slightly. Already in the midst of a colder-than-average period called the Little Ice Age, Europe and North America went into a deep freeze: alpine glaciers extended over valley farmland; sea ice crept south from the Arctic; and the famous canals in the Netherlands froze regularly - an event that is rare today.
The impact of the solar minimum is clear in this image, which shows the temperature difference between 1680, a year at the center of the Maunder Minimum, and 1780, a year of normal solar activity, as calculated by a general circulation model. Deep blue across eastern and central North America and northern Eurasia illustrates where the drop in temperature was the greatest. Nearly all other land areas were also cooler in 1680, as indicated by the varying shades of blue. The few regions that appear to have been warmer in 1680 are Alaska and the eastern Pacific Ocean (left), the North Atlantic Ocean south of Greenland (left of center), and north of Iceland (top center).
If energy from the Sun decreased only slightly, why did temperatures drop so severely in the Northern Hemisphere? Climate scientist Drew Shindell and colleagues at the NASA Goddard Institute for Space Studies tackled that question by combining temperature records gleaned from tree rings, ice cores, corals, and the few measurements recorded in the historical record, with an advanced computer model of the Earth’s climate. The group first calculated the amount of energy coming from the Sun during the Maunder Minimum and entered the information into a general circulation model. The model is a mathematical representation of the way various Earth systems -ocean surface temperatures, different layers of the atmosphere, energy reflected and absorbed from land, and so forth -interact to produce the climate.
When the model started with the decreased solar energy and returned temperatures that matched the paleoclimate record, Shindell and his colleagues knew that the model was showing how the Maunder Minimum could have caused the extreme drop in temperatures. The model showed that the drop in temperature was related to ozone in the stratosphere, the layer of the atmosphere that is between 10 and 50 kilometers from the Earth’s surface. Ozone is created when high-energy ultraviolet light from the Sun interacts with oxygen. During the Maunder Minimum, the Sun emitted less strong ultraviolet light, and so less ozone formed. The decrease in ozone affected planetary waves, the giant wiggles in the jet stream that we are used to seeing on television weather reports.
The change to the planetary waves kicked the North Atlantic Oscillation (NAO) - the balance between a permanent low-pressure system near Greenland and a permanent high-pressure system to its south - into a negative phase. When the NAO is negative, both pressure systems are relatively weak. Under these conditions, winter storms crossing the Atlantic generally head eastward toward Europe, which experiences a more severe winter. (When the NAO is positive, winter storms track farther north, making winters in Europe milder.) The model results, shown above, illustrate that the NAO was more negative on average during the Maunder Minimum, and Europe remained unusually cold. These results matched the paleoclimate record.
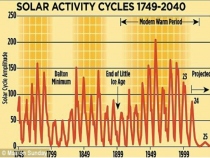
Note: The Maunder Minimum was followed by quiet periods in the 106 and 212 cycles shown as the Dalton Minimum and the early 1900 quiet era.
A quiet sun leads to more -NAO, more cold winter weather. We may be entering at least a Dalton like Minimum, but even if it was like the early 1900s, it could get very cold after the Atlantic follows the Pacific into its cold phase with the low solar (next minimum due around 2020).
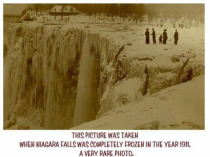
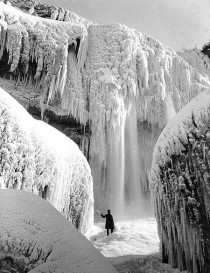
See Niagara Falls in 1911.
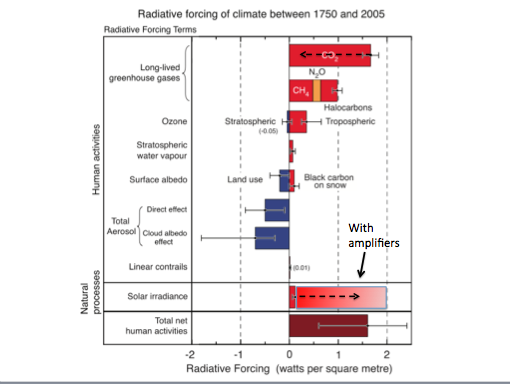
The solar brightness (visible changes only 0.1% in the 11 year cycle), but there are significant amplifiers. We do not have a good estimate of their magnitude but they are much greater than the brightness. They include the UV discussed, the diffusion of cosmic rays which affects the nucleation of low clouds (Svensmark effect) and geomagnetic which produces warming in higher latitudes (ionization visible as the aurora).
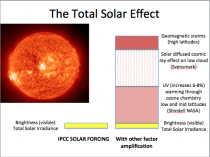
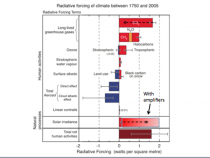
This suggest the IPCC has greatly underestimated the solar effect while the flattening of temperatures for 17 years as per Pachauri and the Hadley center suggest they have seriously overestimated ANY greenhouse warming from CO2. I don’t profess to know exactly what the number are but the arrows suggest the direction.
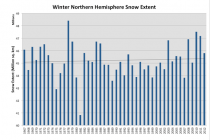
So if the sun continues in its doldrums, we should see more interesting winters. Europe and Asia have had some brutal cold the last 5 years and very heavy snows. Many European scientists are said to be baffled, bewildered and confused by the cold not forecast by their super computer models and some are beginning to believe they don’t understand the climate they way they thought they did. We have had 4 of the top 5 snowiest winters for the hemisphere for the last decade. Remember the forecasts that snow would become a rare commodity.
Wait until the AMO follows the PDO negative with the quiet sun for broad North American cold, but it should be interesting and snow should be in the picture most years.
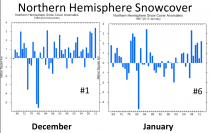
We have not gotten the winter ranking yet, but I would guess 2012/13 will rank high up given December was snowiest ever for the hemisphere and January #6. We were well above in February too.
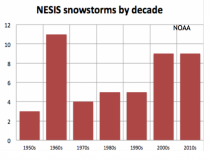
Let’s se if we can add another to the NESIS list. I have added the early February blizzard. If we had a comparable list from NOAA for the central, we might have had one or two this past month and maybe another to come.