


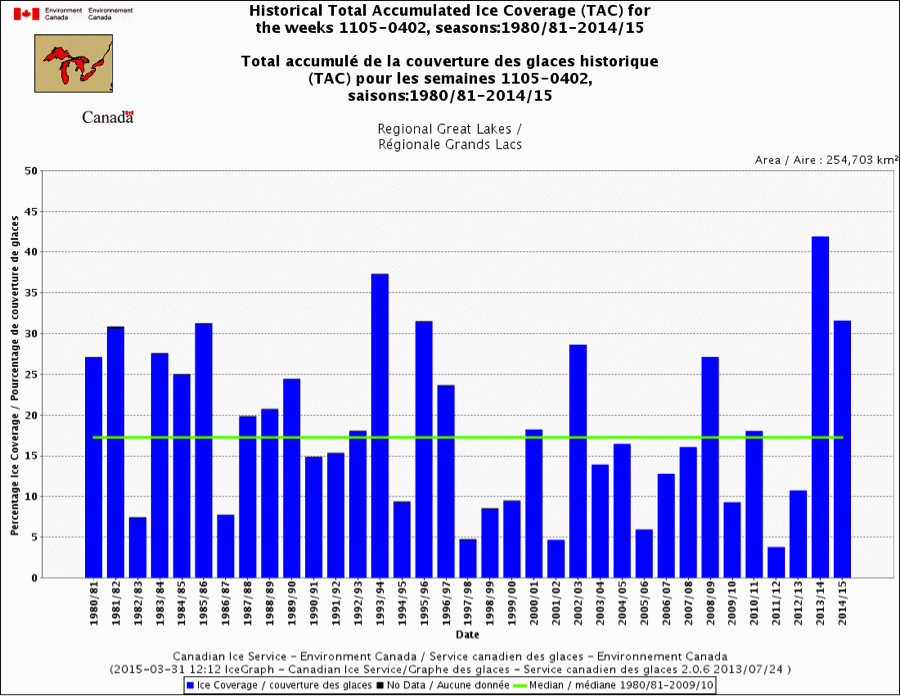
The last two winters have been throwback winters for the Great Lakes and northeast.
No one who has lived in central New England including the Boston area has experienced a 6-week and calendar month as extreme for the combination of cold and snow as we have this late winter. Here in the Nashua area, February 2015 was the coldest month ever recorded with an average temperature of 12.2F. It beat out January 1888, which had averaged 12.9F. A record 18 days had low temperatures zero or below (as cold as 14F below). 25 days remained freezing or below, also a record.
In Boston where temperature records began in 1872, this month was exceeded only by February 1934, which brought Boston their all-time record of -18F. Temperatures never rose out of the 30s this year in February in Boston though it topped 40 four times in 1934.
The cold in February 2015 was not confined to the Boston-Nashua area. It was the coldest month ever in Worcester, Hartford and Portland. It was the coldest February in Chicago and Cleveland and 3rd coldest in New York City, 5th coldest month ever in Detroit and Baltimore, both with records back into the early 1870s.
The year Nashua replaced, 1888, was the year was the year of the Blizzard of ‘88 in March. That storm called ‘The Great White Hurricane’ dumped as much as 50 inches of snow in parts of Connecticut and Massachusetts, while parts of New Jersey and New York had up to 40 inches. Drifts were reported to average 30-40 feet, over the tops of houses from New York to New England, with reports of drifts covering three-story houses. That storm spared eastern New England its worst as milder Atlantic air dominated the early stages of that storm with less than 2 feet here in the Nashua area and just 12” in Boston although 42” fell in southwest New Hampshire at Dublin.
2015 in Nashua had a record February for snowfall, though Boston had more with 64.6 inches and 100.4 inches in the 39 days following January 24th. The 110.6 inches exceeded the 107.6 inch record from 1995/96. The snow that year was spread out over 6 months with thaws, not concentrated so much in less than 6 weeks. The snow blitz and the intense cold is why the snow piles were so high this year.
ONLY 1717 BEAT THIS?
Looking back through accounts of big snows in New England by the late weather historian David Ludlum, it appears for the eastern areas, this winters snowblitz may have delivered the most snow since perhaps 1717.
That year, snows had reached 5 feet in December with drifts of 25 feet in January before one great last assault in late February into early March of 40 to 60 more inches. The snow was so deep that people could only leave their houses from the second floor, implying actual snow depths of as much as 8 feet or more. The New England Historical Society’s account indicated New Hampshire, Massachusetts and Connecticut were hardest hit, a lot like 2015 in what was known as the year of the great snows.
“Entire houses were covered over, identifiable only by a thin curl of smoke coming out of a hole in the snow. In Hampton, N.H., search parties went out after the storms hunting for elderly people at risk of freezing to death… Sometimes they were found burning their furniture because they couldn’t get to the woodshed. People maintained tunnels and paths through the snow from house to house.”
The driver for this winter was a peculiar configuration of ocean warm and cold pools, similar to the frigid winters of 1916/17, 1917/18, 1976/77 and 1977/78. We correctly forecasted the last two historic winters many months in advance based on the ocean patterns. The models suggest the ocean temperatures remain in this configuration this spring and summer resulting in a cool spring and relatively cool and wet summer.
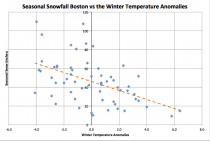
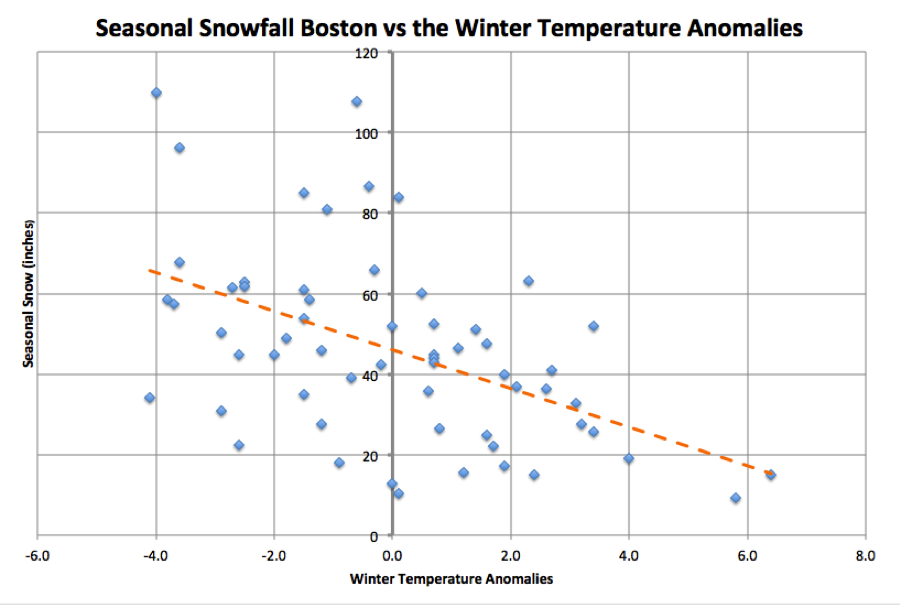
You may hear or read the increased snow is consistent with global warming because warmer air holds more moisture. In actual fact, only 1 of the 14 years with more than 60 inches of snow in Boston was warmer than normal.
Enlarged
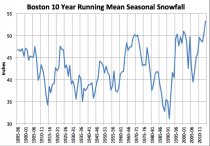
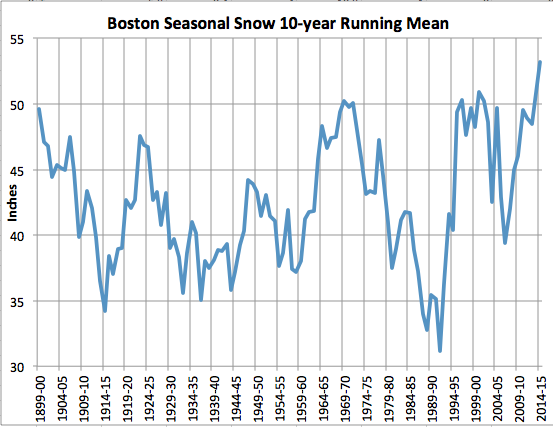
During the 40 days of snowy weather this winter, we averaged over 11F below normal. Cooling increases snowfall not warming. Indeed winter temperatures have cooled over the last two decades in the United States which fits with the fact that 10 year running mean of Boston area snowfall has increased to the highest level since snow records were first kept in 1890.
The cold continued in March here in New England. The month averaged 5.8F below normal here in Nashua and 5.1F below in Boston. There were only four 50F days after no 40F days in February in Boston. This compares with seventeen 50F days, eleven 60F days, seven 70F days and one 80F day in March 2012.
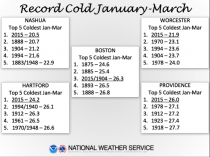
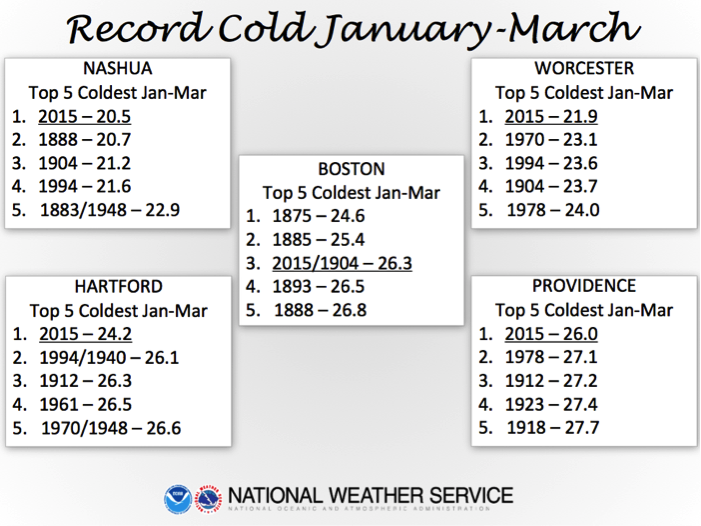
JANUARY TO MARCH RECORD COLD
The January to March average temperatures were the coldest in the entire record in Nashua, Worcester, Providence, Hartford and third coldest in Boston behind only 1885 and 1895.
Ironically 2012 was the warmest first quarter in the record. Despite that spike then, temperatures in the winter (and cold season) in the US (including the northeast states) have declined for over 20 years, which fits with the fact that 10 year running mean of Boston and eastern New England area snowfall has increased to the highest level since snow records were first kept in 1890. This season, most areas of central New England had the snowiest mid to late winter and many spots the snowiest season on record.
The combination of cold and snow here to northern areas and back to the Great Lakes the last two winters, harkens back to the Little Ice Age that ended in the early 20th century.
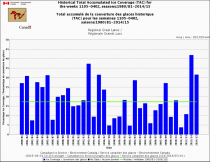
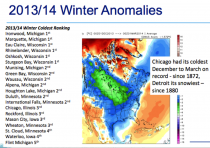
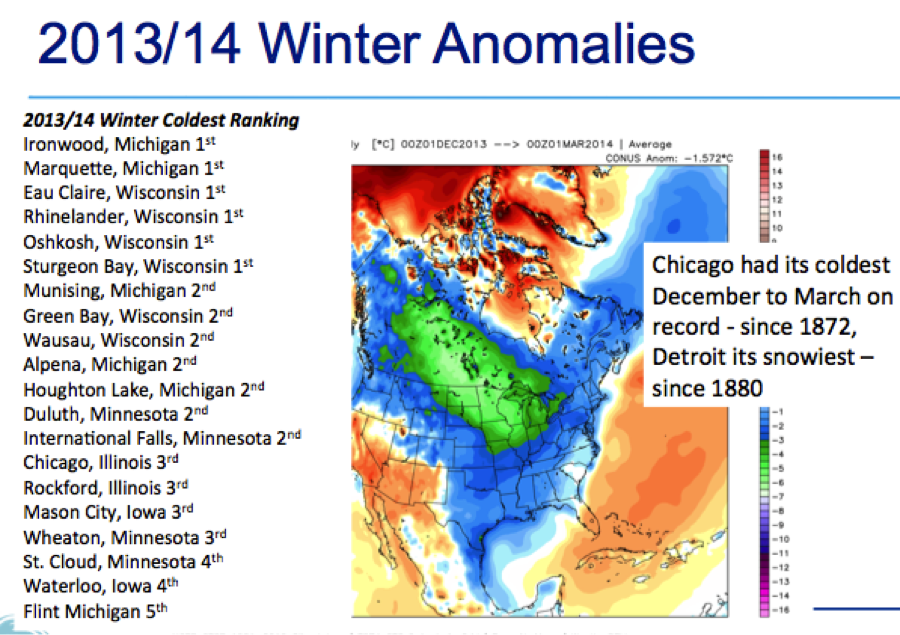
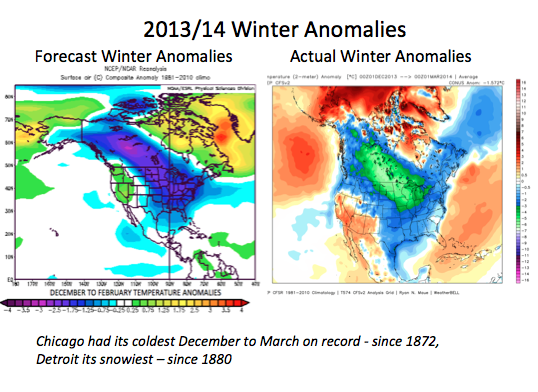
In 2013/14, Chicago had their coldest December to March back to 1872 and third snowiest while Detroit had their snowiest back to 1880.
The Adirondacks in these years usually gets the worst of the arctic cold. Saranac Lake in February 2015 was 13.6F below normal with 23 sub-zero days, no day reaching freezing and 4 record lows. March had 15 days zero or below with 10 record lows. Last March (2014), Saranac Lake was 11.4F below normal with 10 sub-zero days and 7 record lows. These were two amazing late winters.
WHAT IS BEHIND THE EXTREMES?
I learned early in my career from the some of the giants in the field like Jerome Namias how ocean temperature pools that change locations with changes in the global ocean current circulation patterns in conjunction with strong El Nino and La Nina events are important to where the jet stream sets up and how strong and persistent it is. This determines how extreme winters and summer are for both temperature and precipitation.
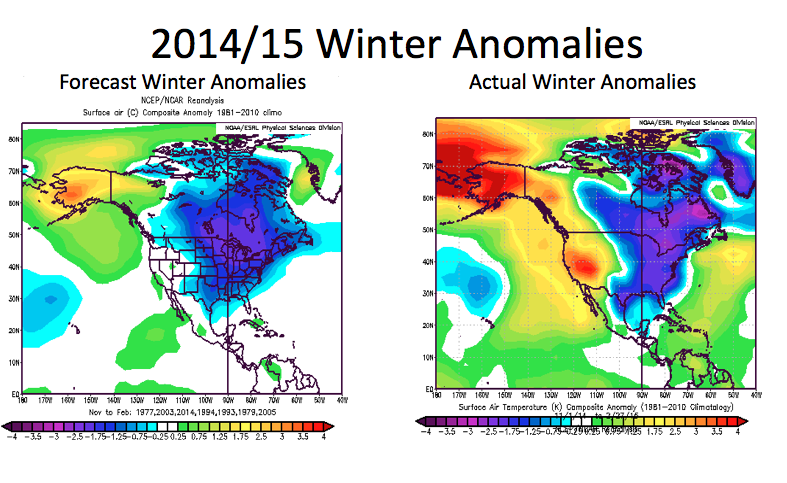
A super La Nina in 2010/11 (2nd strongest in 120 years by some measures), set up warm water in the central Pacific and cold water near the west coast of North America, which lead to that record warm and droughty 2011/12 central and eastern winter, spring and summer. That warm water came east first to off of Alaska last year leading to the historic winter near the western Lakes and North Central and then the warm water was carried by the currents southeast to the entire west coast forcing the cold to take aim more on the eastern Lakes and Northeast.
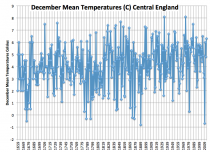
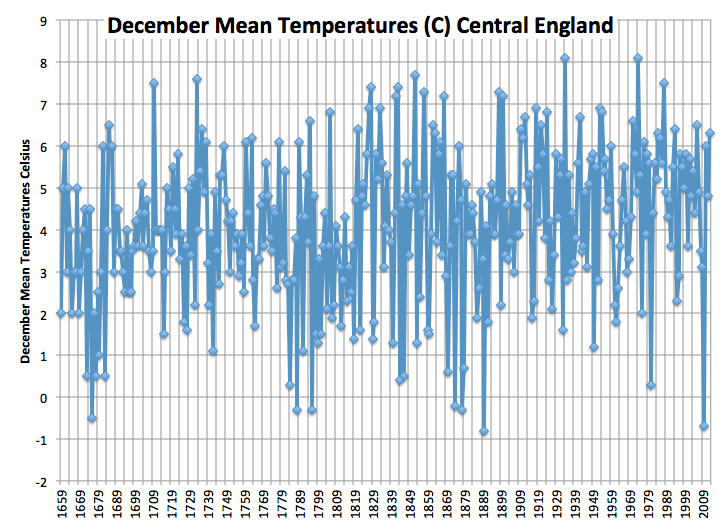
Similar changes occurred in the Atlantic. Starting in 2007, warm North Atlantic helped build high pressure in the Polar Regions and drive Siberian air west to Europe where in December 2010, the UK had their second coldest December since 1659 in the Little Ice Age.
Though scientists had warned them snow was a thing of the past, the UK and much of northern Europe had all-time record snows and cold in 5 of 6 years. The North Atlantic turned cold last year and more so this year and Europe turned milder. But a cold North Atlantic means colder and snowier winters in eastern Canada, the Great Lakes and northeast. The Atlantic thus helped exaggerate the Pacific driven cold last two winters.
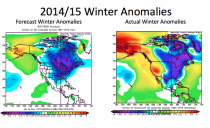
At Weatherbell.com, where we use the oceans and sun in our statistical models for long-range prediction, we successfully predicted many months in advance these historic winters.
