


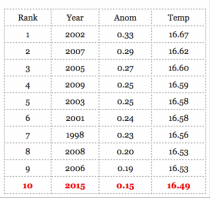
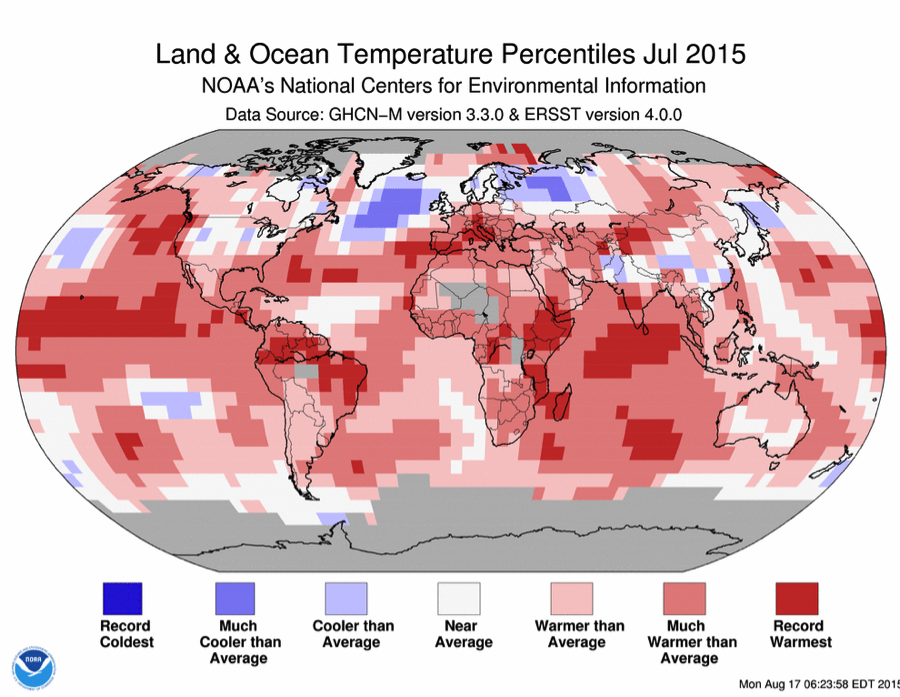
NOAA RELEASE: The July 2015 average temperature across global land and ocean surfaces was 1.46F (0.861C) above the 20th century average. As July is climatologically the warmest month for the year, this was also the all-time highest monthly temperature in the 1880 to 2015 record, at 61.86F (16.61C), surpassing the previous record set in 1998 by 0.14F (0.08C).
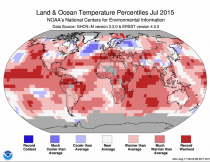
“It just reaffirms what we already know: that the Earth is warming,”said NOAA climate scientist Jake Crouch. “The warming is accelerating and we’re really seeing it this year.”
SORRY JEFF, YOU HAVE BEEN DRINKING TOO MUCH GOVERNMENT KOOL-AID (WARM-AID?).
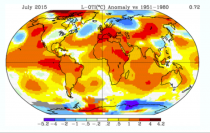
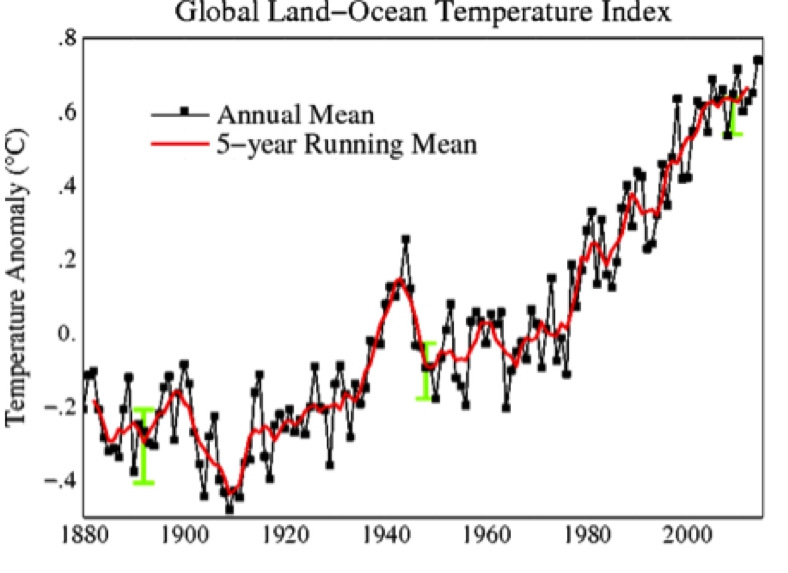
NASA reported a global anomaly of 0.72C (1.29F), also the highest in their entire record (base period for comparison 1951-1990).
Enlarged
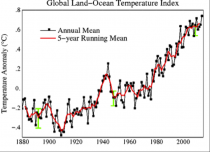
Sure looks conclusive. But global data bases are seriously flawed and easily manipulated and can no longer be trusted to assess climate trends.
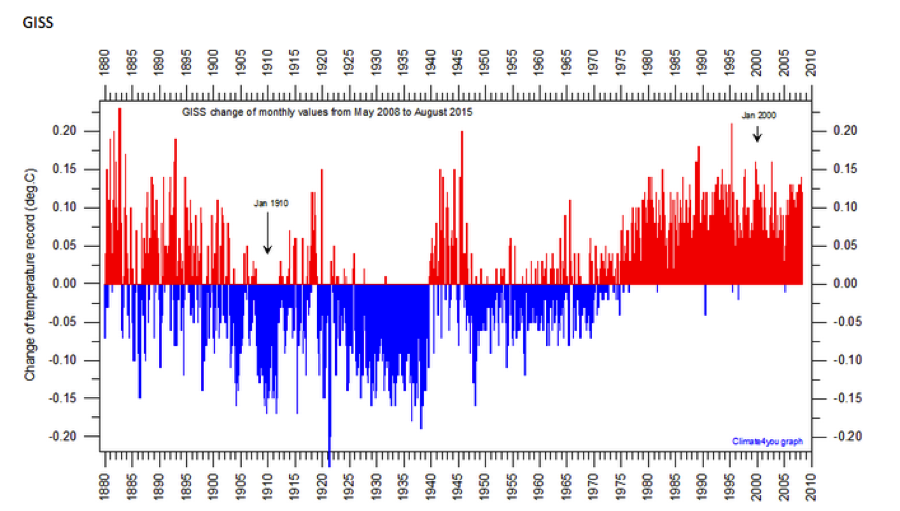
Numerous versions of the global data have been issued in the past 25 years. Each one produced more and more of an apparent warming, accomplished by cooling the past and allowing urban heat island to run rampant in recent decades. See this NASA change graph DIFFERENCE from the latest version in 2015 from the version in 2008. You can see it has increased the apparent warming from the 1930s to the present by about 0.3C (0.5F).
The net effects of the adjustments made since May 2008 are to generate a more smoothly increasing global temperature since 1880. In fact most all of the claimed warming is in the adjustments to the data.
This is before NCDC adds the adjustments to get the results demanded for. Predictably, NOAA and NASA adjusted their July temperatures as they did in June and May and in 2014 just enough to be able to make the claims warmest ever, all leading up to the UN treaty in Paris later this year.
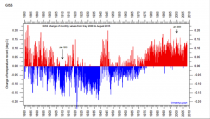
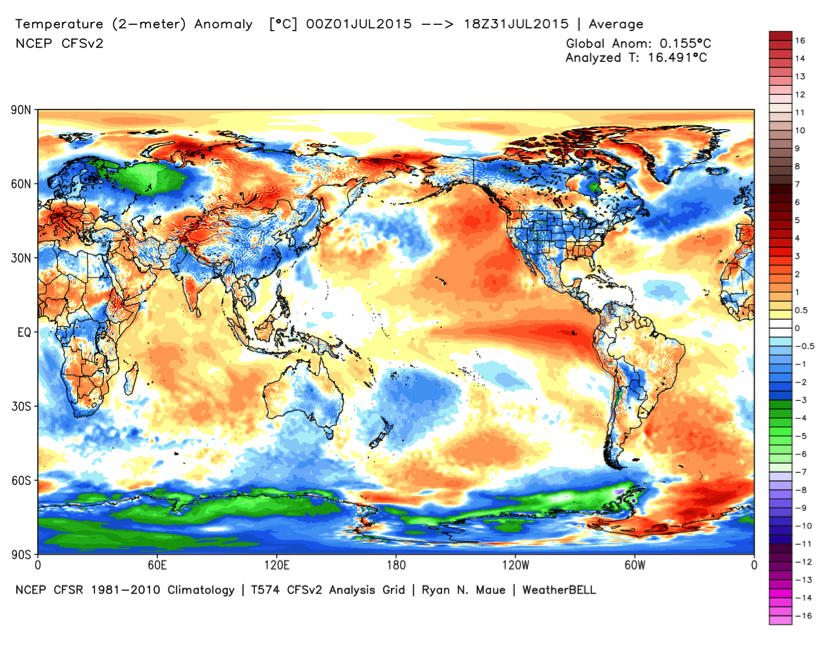
Meteorologists and in fact NOAA itself in their models ignores this ‘adjusted data’. NOAA uses many raw data inputs to construct a high-resolution global analysis four times a day that is used to initialize the all the models (including their climate models) used by forecasters in government and industry. Weatherbell’s Dr. Ryan Maue compiled the four times a day data going back to 1981 and computes in real-time our own monthly global picture. You will notice with a base period of 1981-2010, the anomaly globally is not even close to NOAA’s 0.81C nor NASA’s 0.72C but just 0.155C. Some of the difference has to do with the base period used for the averages to compute anomalies but most of it is in the adjustments and blending techniques and how they infill for large data gaps or widespread missing surface station data.
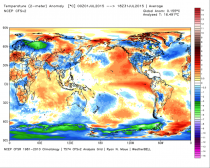
Notice the very cold Southern Hemisphere high latitude oceans/ Antarctic, ignored by NOAA though included by NASA.
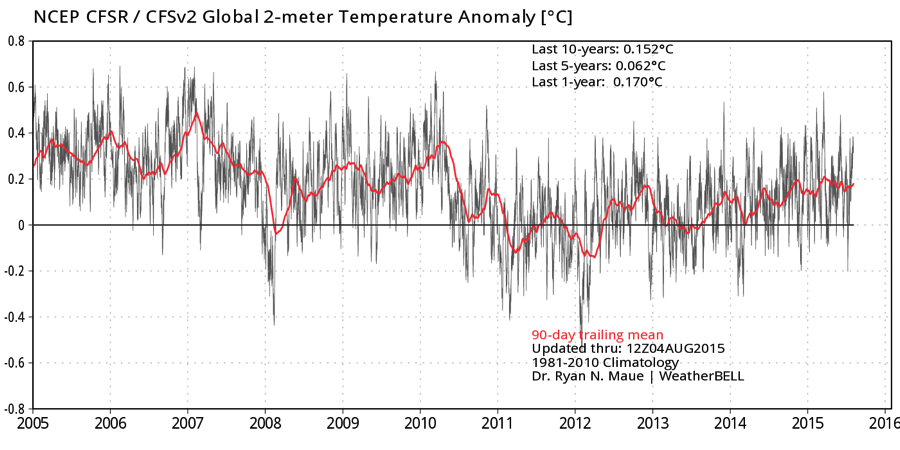
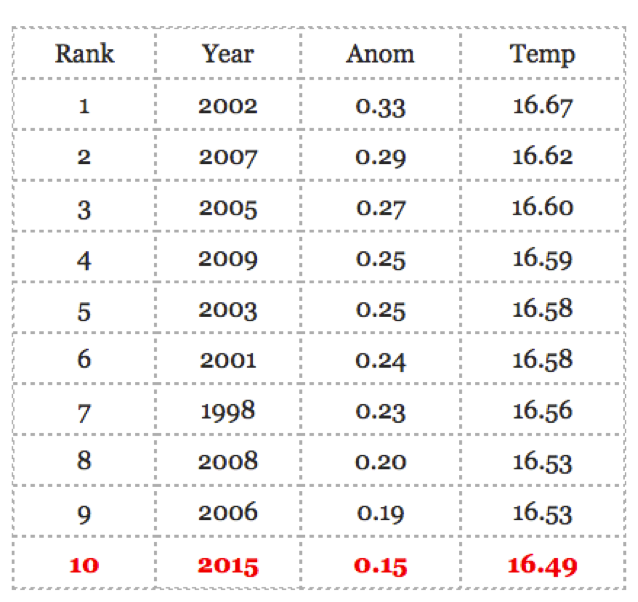
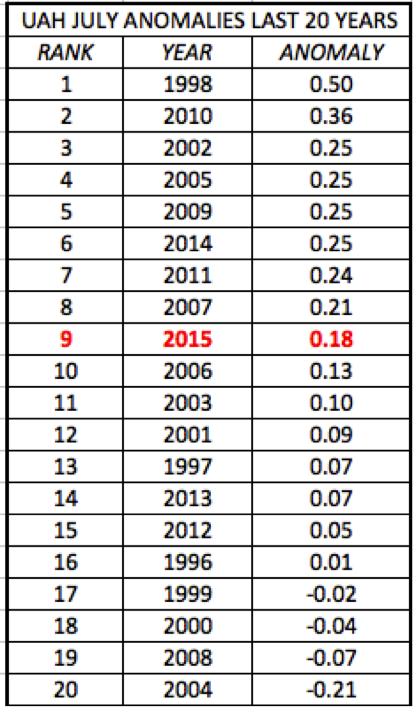
The temperatures in this reanalysis data shows no warming for over 10 years and the +0.155C anomaly is in the middle of the pack of Julys for the last decade, not the warmest ever. It ranked 10th warmest in the last 20 years.

SATELLITE DATA
Since 1979, NOAA satellites have been carrying instruments, which measure the natural microwave thermal emissions from oxygen in the atmosphere. The intensity of the signals these microwave radiometers measure at different microwave frequencies is directly proportional to the atmospheric temperatures.
The advantage of the satellites is they provide complete global coverage, and are not biased by local heat sources like most weather instruments in cities or airports.
There are two satellite remote sensing groups the NASA UAH site in Huntsville, Alabama and Remote Sensing Systems, a scientific research company located in California, specializing in satellite microwave remote sensing of the Earth.
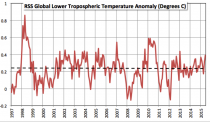
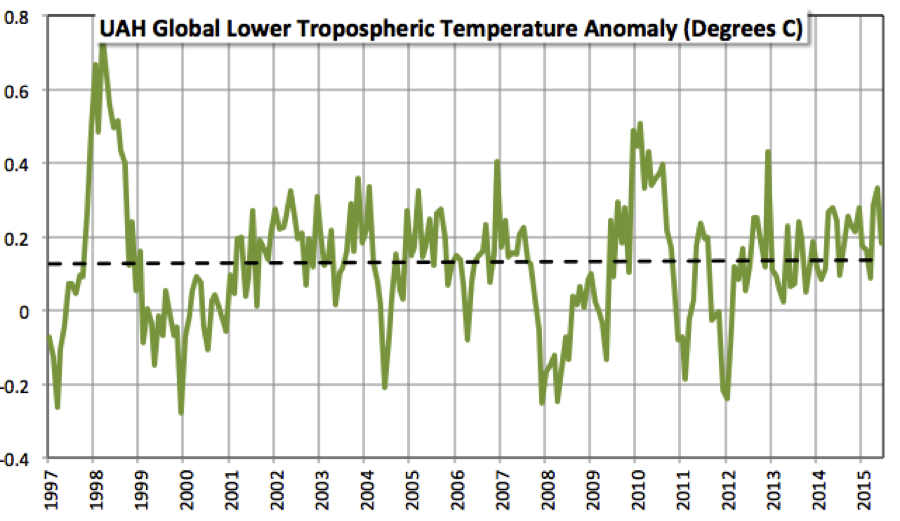
Both satellite sources showed there has been no warming trend for over 18.5 years. Both showed July and recent months were not even close to being warmest even in just the last 20 years.
Dr. John Christy, Alabama Climatologist and Director of the Earth System Science Center at the UAH said “According to microwave data from satellites going back to 1978, which are precise to within .08 of a degree, “very little warming is taking place.”
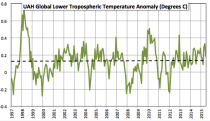
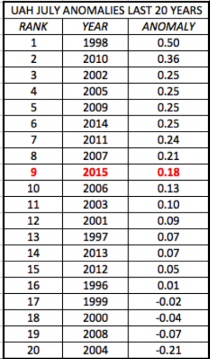
UAH assessed lower troposphere temperatures have not warmed for over 18 years. The data showed global temperatures for July 2015 were the 9th warmest in the last 20 years.
July 2015 in the RSS data set just edged out 2003 for 8th place, but it was 0.32 C (0.58F) colder than 1998.
So three much more reliable sources suggest that July 2015 was not remarkable or special from a temperature standpoint
That is not to say that given the strong El Nino underway, we won’t see a spike up as we did in the satellite data in 1998 and 2010, but with a long strong La Nina likely to follow (like we saw in 1998-2000 and 2010/11), global temperatures will dive again and the pause is likely to give way to a slide starting in late 2016. How long NOAA or NASA waits before they let you see it in their data is the question.
The problem is that the same staff at NOAA and NASA responsible for running some of the greenhouse models and writing the reports that project the scary scenarios are also responsible for the data bases that validate the forecasts. The actual data should be constructed independently of the forecasts with people who do not have a financial and personal interest in seeing their forecasts verify.
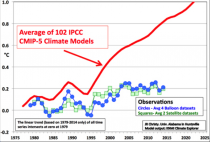
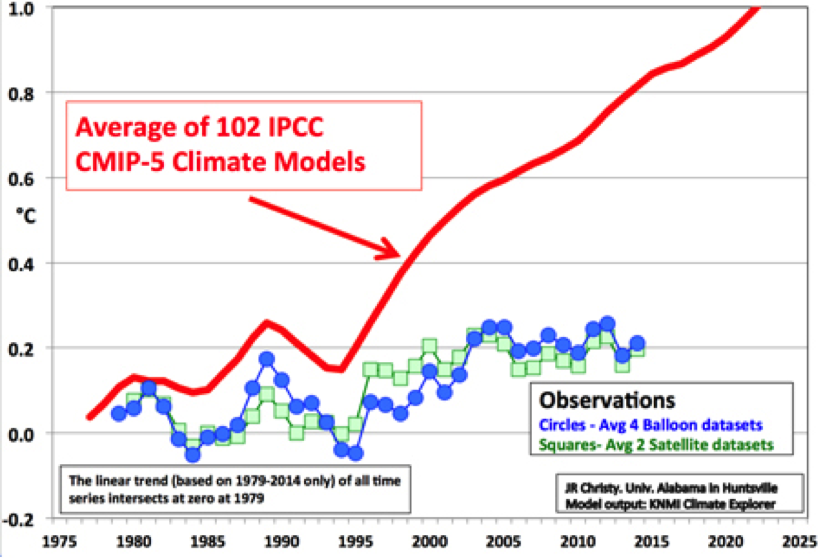
Indeed we see in the independent data sets like the satellite and balloon based ones, widespread model failures. The failure of temperatures to warm invalidates all the other scary scenarios they claim we will or are already experiencing.
Enlarged
There is a lot of flexibility available for modelers to predict a desired result and data source inconsistencies to allow NOAA to be creative with a hybrid of data and models to show whatever the puppet masters in government require. It may be that some really believe in their science and work hard to mine the data, achieving a form of bias confirmation. In other cases it is ideologically or politically driven or simply a matter of job security
A look at all the data suggests that man made global warming is real but the men are in Asheville (NOAA NCDC) and New York CIty (NASA GISS).