


By Dr. Anthony Lupo
On July 1, NOAA’s National Climatic Data Center (NCDC) released the new 1981-2010 normals for weather and climate recording stations across the United States [1], and it was no surprise that these normals were, in general, warmer than the 1971-2000 normals. While global temperatures and US temperatures have leveled off or have begun to trend downward since their late 1990s high, the decade of the 2000s was warmer than that of the 1970s. Thus, it is no surprise that across the US, and as acknowledged by the NCDC director, these new normals are roughly 0.5F warmer than the 1971-2000 normals. But, this does not mean they were uniformly higher everywhere as an examination of California’s temperatures demonstrates [2].
These 30 year normals are derived in order to provide the general public with a baseline reference for what is typical for variables such as temperature using a recent period and definition of climate. The classical definition for what constitutes climate is 30 years, and this can be found for example on the World Meteorological Organization (WMO) website [3]. This is a long enough period so that year-to-year and even interannual variations do not influence the baseline, and it is not too long relative to human life spans.
Even though the warmer 1981-2010 was not a surprise to climate scientists, media outlets reacted to the news predictably. For example one major newspaper [4] led their story with the statement; ‘The new normal is warmer’. In their story, they interviewed two scientists who confirmed the narrative that these warmer normals are a smoking gun showing that global warming is here and happening. One scientist said this was evidence for it, and another said “It means a lot of global warming is built into the new normals”.
To be fair, the article also interviewed Dr. Tim Ball, who is a leading climate skeptic. He points out that comparing the numbers themselves within two consecutive 30year periods can be misleading since trends within each can be different. Additionally, NOAA has issued these normals since 1956 beginning with the 1921-1950 period. Thus, these numbers could be checked back further in time rather than jumping to the conclusion that the new normals are evidence of global warming.
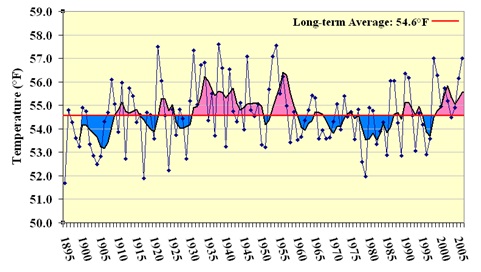
Using the data for my own location in Missouri was not difficult. An examination of Table 1 and Fig. 1 will demonstrate that the 1981-2010 normals overall are about 0.4 F warmer here than the 1971-2000 values, which is consistent with the NOAA finding for the US in general. But, going back further time will demonstrate that for my location, 1981 - 2010 has yet to catch up with the first 30 year products that came out historically (1921-1950, and then 1931-1960). Global warming indeed! But, this shows the impact that the warm 1930s had on these early products. Many skeptics like Dr. Ball have pointed out for a long time that the 1930s were at least comparable to recent years in the United States.
Additionally, examining Table 1 and Fig. 1 demonstrates that these running 30 year periods do act in a mathematical sense as a data filter, but one that may produce a ‘trend’ out of phase with reality. This is the essence of Dr. Ball’s comment. For example, the first two periods in Table 1 give the same average, but by 1930, temperatures were clearly on the rise (Fig. 1). Thus, these 30 year averages lag behind shorter term trends. This can also be seen by comparing the data for the 1921-1960 period in Table 1 and Fig. 1. The second 30-year period was slightly warmer in spite of temperatures trending downward in the 1950s. Additional basic information about these 30 year normal products can also be found on the “Watts up with that?” Climate information website[5].
In light of the fact that temperatures during the 2000s have leveled off or begun to fall, it is not surprising that the new normals have yet to catch up to this fact. Thus, the new 30 year normals cannot be used as evidence for global warming.
Table 1. The 30 year annual “normals” for Columbia, MO from 1890 - 2010 to the nearest 0.1F.
Period Annual Means (F)
1891-1920 54.3
1901-1930 54.3
1911-1940 55.1
1921-1950 55.4
1931-1960 55.6
1941-1970 55.0
1951-1980 54.5
1961-1990 54.2
1971-2000 54.2
1981-2010 54.6
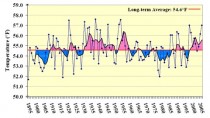
Figure 1. Enlarged. The mean annual temperatures (F) for the state of Missouri versus time (years). (Produced by the Missouri Climate Center)
References:
[1] Leslie, J, 2011: NOAA: Average U.S. temperature increases by 0.5 degrees F. NOAA Press Release, 29 June, 2011.
[2] Fimrite, P., 2011: CA climate: inland warmer; coast cooler and wetter. San Francisco Chronicle. 6 July, 2011.
[3] World Meteorological Organization
[4] Rodriguez, A., 2011: NOAA report shows warmer weather in U.S. Los Angeles Times. 30 June, 2011.
[5] Anthony Watts Commentary on Climate Change and more.