


By Joseph S. D’Aleo, CCM, Fellow of the AMS
It was the eighth warmest June on record for the globe, the National Oceanic and Atmospheric Administration reported Wednesday in the 129 years since records began in 1880. And the first six months of the year were the ninth warmest since record keeping began in 1880, NOAA’s National Climatic Data Center reported. The planets average temperature for June was 60.8 degrees Fahrenheit, 0.9 degrees warmer than average for the month.
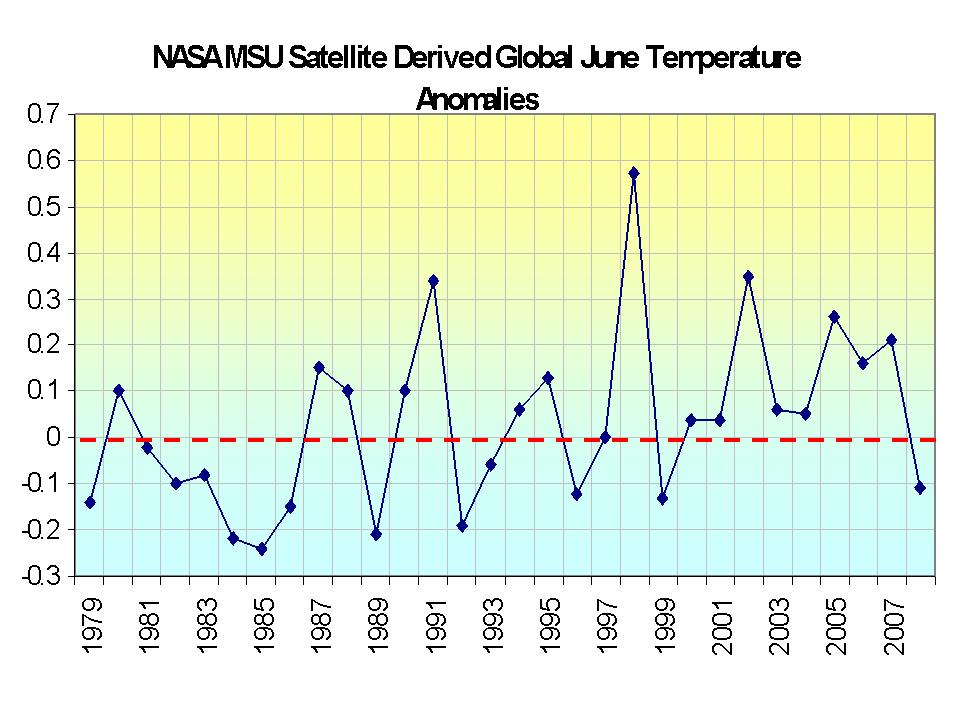
DON’T BELIEVE A WORD OF IT. Just a few days ago, the University of Alabama, Huntsville came out with their global assessment and they reported the 22nd warmest in the 30 years of records in their data base (in other words the 9th coldest). In fact, their global mean was actually below the average (base period 1979-1998) with a value of -0.11C (-0.19F). This is a full 1.1F degrees colder than the NOAA guesstimate. The other NASA satellite source, RSS had June as the 13th coldest out of the last 30 years.
NASA MSU June Temperatures since 1979. See larger version here.
The global data bases suffer from major station dropout after 1990 (number dropped from 6000 to less than 2000) and a ten fold increase in the number of missing months in the stations that report. There are serious problems with their algorithms for assessing whether a station is urban or rural and adjusting for local land use changes. There are major siting issues, many of which Anthony Watts, Steve McIntyre and Roger Pielke Sr. have shown have not been properly adjusted for. An old version of a document describing these issues can be found here. Please note the NERON networks plans of NOAA morphed into the Climate Reference Network, a relatively small number (110 if fully implemented) properly sited instrument locations that should provide a better tracking of at least US climate in the future but will not resolve the historical US and current global discrepancies. A detailed discussion of the Urban Heat Island (UHI) contamination issue can be found here. Thes issues have lead researchers in numerous peer review papers ignored by the data centers and IPCC to produce overestimation of the warming globallly by 30 to 50%.
Time has come for a major independent investigation of the data sets, compilation methodology and adjustment practices (and records) for the global data sets of NOAA, NASA and Hadley. Steve McIntyre and Anthony Watts are doing their best finding problems but Steve has run into many roadblocks suggesting folks may have something to hide. Meanwhile we will trust only the UAH and RSS.
Try this to see for yourself how bad the global station data is. Go to this site (GISS - virtually the same as NOAAs GHCN though the adjustments made differ), scroll down to the map and click on any region. You will see stations listed - notice the highly variable reporting periods. Start clicking on stations. You will get plots. But before you move to other stations go to the bottom and click on “Download monthly data as text”. You will see for many/most stations numerous “999.9"s meaning missing data. How do you come up with annual averages when one to multiple months are missing? That is like making beef stew but without the beef. I was told that in many cases the data is available (Environment Canada tells us they have their data we show as missing) but that NOAA and NASA is making no efforts to go out and get it. Our cry should be after every NOAA press release “Where is the beef?”