


By Steve McIntyre on Climate Audit
Thompson et al 2008, writing in Nature, assure their readers, the data before ~1940 and after the mid-1960s are not expected to require further corrections for changes from uninsulated bucket to engine room intake measurements. Is there a shred of evidence to support this assertion? There is convincing evidence otherwise - evidence already reported here. While Thompson et al do confirm some Climate Audit observations, on essential points, their analysis is actually a step backwards from my 2007 posts (one here).
The hypothesis of the original Hadley Center Windowed Marine De-trending program was that there was an approximate 0.3 deg C inhomogeneity between engine inlet SST measurements and canvas bucket measurements and that there was a drop-dead changeover on December 1941, a switch which continued in place to the present day.
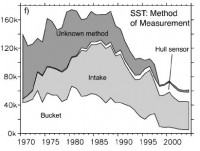
In earlier posts, I showed that there was strong documentary evidence against this assumption and hypothesized that there was a return to “business as usual” after the war. On the post-1960s period, they have completely lost their bearings and are, so to speak, lost at sea. Thompson et al 2008 completely failed to discuss or cite the most relevant graphic in Kent et al - a graphic previously reproduced at Climate Audit on a number of occasions - and reproduced one more time below. This graphic, based on a very comprehensive examination of metadata, showed the distribution of measurement type from 1970 to 2006.
See full size image
In 1970, as I observed last year, about 90% (this is a visual estimate from the graphic) of SST measurements, for which the type is known, were done by buckets. Because the proportion with metadata is a very large sample, it’s plausible to use this 90% estimate for the entire population, including the unknown population. Between 1970 and 2006, the proportion of bucket and engine inlet measurements is more or less reversed, with about 90% of SST measurements in the 2000s being engine inlet or hull sensor, the latter by the way, being a further addition to the witches’ brew that the Nature boys didn’t mention at all. However, Thompson et al 2008 completely failed to grasp the significance of this graphic. The changeover to engine inlet measurements, previously attributed to a drop-dead date in 1941, actually took place after 1970 (providing, of course, for a one-off WW2 adjustment ending in 1945).
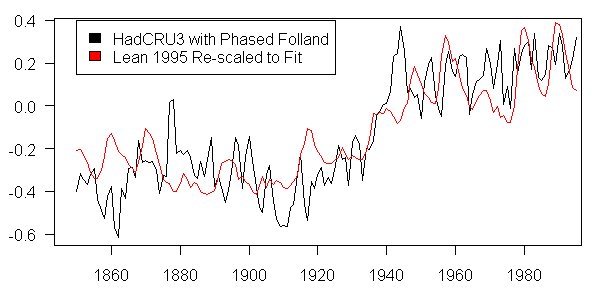
Icecap Note: In an earlier post here in this comment Steve noted “I took the graphic (above) in which the Folland adjustment was phased in allowing for the fact that 90% of known SST measurements in 1970 were done by bucket and not engine inlet and regressed that against a solar index that I had handy (Lean 1995) and plotted the two series together. Here’s what I got and this is the first pass without any attempt at designing:

See full size image
The correlation between the two series was 0.80 going from 1850 to 1995, the last year of the Lean 1995 solar estimate. I’ll compare this to Lean 2000 as well. This isn’t a “decadal” correlation or some such either. This is using the annual data.” Icecap Note: As another commenter noted, Real Climate which claimed the rapid cooling after WWII refuted the solar as a factor needs to rethink that (and a lot more). Read more of Lost at Sea here.
Update see the Battle between Real Climate and Prometheus over this issue here.