


NASA MSFC
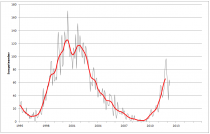
The current prediction for Sunspot Cycle 24 gives a smoothed sunspot number maximum of about 60 in the Spring of 2013. We are currently over three years into Cycle 24. The current predicted size makes this the smallest sunspot cycle in about 100 years.
The prediction method has been slightly revised. The previous method found a fit for both the amplitude and the starting time of the cycle along with a weighted estimate of the amplitude from precursor predictions (polar fields and geomagnetic activity near cycle minimum). Recent work [see Hathaway Solar Physics; 273, 221 (2011)] indicates that the equatorward drift of the sunspot latitudes as seen in the Butterfly Diagram follows a standard path for all cycles provided the dates are taken relative to a starting time determined by fitting the full cycle. Using data for the current sunspot cycle indicates a starting date of May of 2008. Fixing this date and then finding the cycle amplitude that best fits the sunspot number data yields the current (revised) prediction.
Predicting the behavior of a sunspot cycle is fairly reliable once the cycle is well underway (about 3 years after the minimum in sunspot number occurs [see Hathaway, Wilson, and Reichmann Solar Physics; 151, 177 (1994)]). Prior to that time the predictions are less reliable but nonetheless equally as important. Planning for satellite orbits and space missions often require knowledge of solar activity levels years in advance.
A number of techniques are used to predict the amplitude of a cycle during the time near and before sunspot minimum. Relationships have been found between the size of the next cycle maximum and the length of the previous cycle, the level of activity at sunspot minimum, and the size of the previous cycle.
Among the most reliable techniques are those that use the measurements of changes in the Earth’s magnetic field at, and before, sunspot minimum. These changes in the Earth’s magnetic field are known to be caused by solar storms but the precise connections between them and future solar activity levels is still uncertain.
Of these “geomagnetic precursor” techniques three stand out. The earliest is from Ohl and Ohl [Solar-Terrestrial Predictions Proceedings, Vol. II. 258 (1979)] They found that the value of the geomagnetic aa index at its minimum was related to the sunspot number during the ensuing maximum. The primary disadvantage of this technique is that the minimum in the geomagnetic aa index often occurs slightly after sunspot minimum so the prediction isn’t available until the sunspot cycle has started.
An alternative method is due to a process suggested by Joan Feynman. She separates the geomagnetic aa index into two components: one in phase with and proportional to the sunspot number, the other component is then the remaining signal. This remaining signal has, in the past, given good estimates of the sunspot numbers several years in advance. The maximum in this signal occurs near sunspot minimum and is proportional to the sunspot number during the following maximum. This method does allow for a prediction of the next sunspot maximum at the time of sunspot minimum.
A third method is due to Richard Thompson [Solar Physics 148, 383 (1993)]. He found a relationship between the number of days during a sunspot cycle in which the geomagnetic field was “disturbed” and the amplitude of the next sunspot maximum. His method has the advantage of giving a prediction for the size of the next sunspot maximum well before sunspot minimum.
We have suggested using the average of the predictions given by the Feynman-based method and by Thompson’s method. [See Hathaway, Wilson, and Reichmann J. Geophys. Res. 104, 22,375 (1999)] However, both of these methods were impacted by the “Halloween Events” of October/November 2003 which were not reflected in the sunspot numbers. Both methods give larger than average amplitude to Cycle 24 while its delayed start and low minimum strongly suggest a much smaller cycle.
The smoothed aa index reached its minimum (a record low) of 8.4 in September of 2009. Using Ohl’s method now indicates a maximum sunspot number of 70 plus/minus 18 for cycle 24. We then use the shape of the sunspot cycle as described by Hathaway, Wilson, and Reichmann [Solar Physics 151, 177 (1994)] and determine a starting time for the cycle by fitting the latitude drift data to produce a prediction of the monthly sunspot numbers through the next cycle. We find a maximum of about 60 in the Spring of 2013. The predicted numbers are available in a text file, as a GIF image, and as a pdf-file. As the cycle progresses, the prediction process switches over to giving more weight to the fitting of the monthly values to the cycle shape function. At this phase of cycle 24 we now give 66% weight to the amplitude from curve-fitting technique of Hathaway, Wilson, and Reichmann Solar Physics 151, 177 (1994). That technique currently gives similar values to those of Ohl’s method.
Note: These predictions are for “smoothed” International Sunspot Numbers. The smoothing is usually over time periods of about a year or more so both the daily and the monthly values for the International Sunspot Number should fluctuate about our predicted numbers. The dotted lines on the prediction plots indicate the expected range of the monthly sunspot numbers. Also note that the “Boulder” numbers reported daily at http://www.spaceweather.com are typically about 35% higher than the International sunspot number.
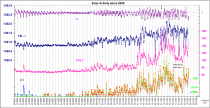
Another indicator of the level of solar activity is the flux of radio emission from the Sun at a wavelength of 10.7 cm (2.8 GHz frequency). This flux has been measured daily since 1947. It is an important indicator of solar activity because it tends to follow the changes in the solar ultraviolet that influence the Earth’s upper atmosphere and ionosphere. Many models of the upper atmosphere use the 10.7 cm flux (F10.7) as input to determine atmospheric densities and satellite drag. F10.7 has been shown to follow the sunspot number quite closely and similar prediction techniques can be used. Our predictions for F10.7 are available in a text file, as a GIF image, and as a pdf-file. Current values for F10.7 can be found at: http://www.spaceweather.ca/sx-4-eng.php.
----------------------
Leif Svalgard maintains a summary of all the parameters.
----------------------
Jan Janssens adds
You may want to consult my webpage “Evolution of SC24”.
Besides sunspot numbers, it tracks also solar flares, geomagnetics, radio flux, cosmic rays,…
An overview of SC24-predictions (made prior to 2009 = prior to SC-minimum) can be found at this link.
At this time (only 40 months after cycle minimum), we have not reached SC24-maximum yet. This is expected to occur in the first half of 2013.
Currently, we seem to be in a standstill very similar to what happened during SC23 (albeit this time later in the cycle and at a lower sunspot level:
see).
BTW, all of the continental heat extremes occurred in the lower solar periods.
This is because the meridional patterns seem to persist when the sun is less active. That partially explains the persistant cold in the Paciifc Northwest down to coastal California while areas to the east have been stuck warm. The second strongest La Nina in 110 hears is also likely playing a role resulting in an enhanced cold PDO with cold water off the west coast and warm north of Hawaii. This helps maintain a western trough and downstream ridge. That appears to be breaking down as El Nino comes on now as it did in 2009.
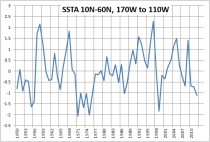
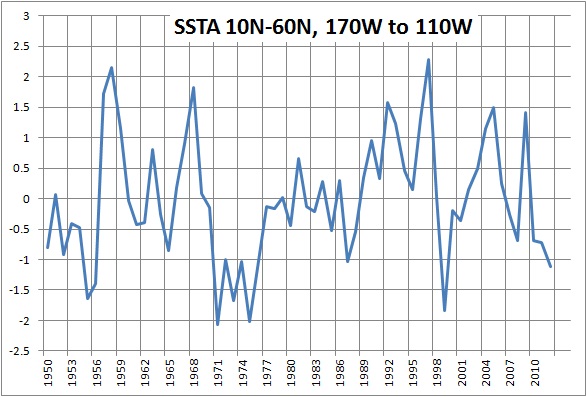
Here is a plot of the water anomalies in the eastern Pacific.
The pendulum is likely to swing as it did in 2009. By the way the last regime with waters cold in the east was the early 1970s, a period where the Atlantic was cold. That made a difference. As now we are in the warm mode which favors continental warmth in summer in the Northern Hemisphere. But this last year has been US specific.
NOAA making big deal about last 12 months being the warmest ever. John Christy provides color.
Here are the sectors from MSU TLT in deg C. Max12mo is highest 12-month average value beginning with Dec78-Nov79 and going forward month by month. Right column is latest 12-month running mean (Jun2011-May2012). Latest USA48 is essentially tied with the value from Oct1999-Sep2000. The USA48 is the interesting story because other sectors (larger) are less than half of hottest value. Note at bottom - Alaska was well below average for Jun2011-May2012 (record low was -1.131 C, and doing this quickly I couldn’t add in the small part adjacent to BC.)
Sectors
Trpcs 20S-20N
NoExt 20N-85N
SoExt 85S-20S
Pol 60 to 85
UAH LTv5.4
Region............ Record Max............Last Year

Remember NASA GISS’s own words:
“"Everyone appears also to agree that too much attention is paid to records, particularly given that the difference between 1934, 1998, and several other sets of years in the top 10 warmest list for the United States are so small as to be statistically meaningless.”
Dr. Hansen and his team note that they rarely, if ever, discuss individual years, particularly regional findings like those for the United States (the lower 48 are only 2 percent of the planet’s surface). “In general I think that we want to avoid going into more and more detail about ranking of individual years,” he said in an e-mail message. “As far as I remember, we have always discouraged that as being somewhat nonsensical."”