


By Roger Pielke Sr.
When I served on the committee that resulted in the CCSP (2006) report on reconciling the surface and tropospheric temperature trends, one of the issues I attempted to raise was a warm bias in the construction of long term surface temperature trends when near surface land minimum temperatures (and maximum temperatures when the atmospheric boundary layer remained stably stratified all day, such as in the high latitude winter) were used. This error will occur even for pristine observing sites. Tom Karl and his close associates suppressed this perspective as I document in
Pielke Sr., Roger A., 2005: Public Comment on CCSP Report “Temperature Trends in the Lower Atmosphere: Steps for Understanding and Reconciling Differences”. 88 pp including appendices.
As a result of the poor treatment by Karl as Editor of the CCSP (2006) report, I decided to invesitgate this issue, and others, in a set of peer reviewed papers with colleagues (listed here in the full post).
We now have a new paper accepted which documents further a warm bias in the use of multi-decadal global surface temperature trends to assess global warming. It is: Klotzbach, P.J., R.A. Pielke Sr., R.A. Pielke Jr., J.R. Christy, and R.T. McNider, 2009: An alternative explanation for differential temperature trends at the surface and in the lower troposphere. J. Geophys. Res., in press.
The abstract of the Klotzbach et al (2009) paper reads
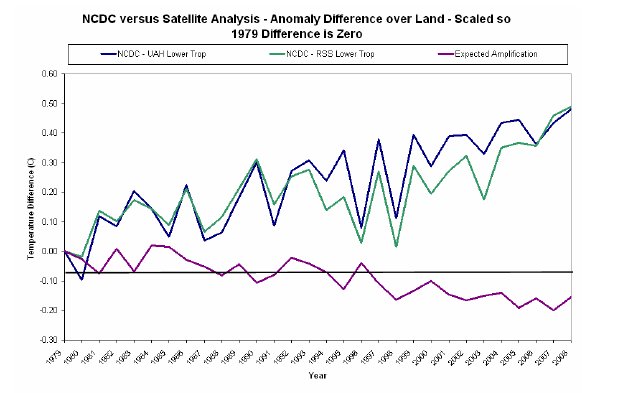
“This paper investigates surface and satellite temperature trends over the period from 1979-2008. Surface temperature datasets from the National Climate Data Center and the Hadley Center show larger trends over the 30-year period than the lower-tropospheric data from the University of Alabama-Huntsville and Remote Sensing Systems datasets. The differences between trends observed in the surface and lower tropospheric satellite datasets are statistically significant in most comparisons, with much greater differences over land areas than over ocean areas. These findings strongly suggest that there remain important inconsistencies between surface and satellite records.”
NCDC minus UAH lower troposphere (blue line) and NCDC minus RSS lower troposphere (green line) annual land temperature differences over the period from 1979-2008. Larger image here.
“We find that there have, in general, been larger linear trends in surface temperature datasets such as the NCDC and HadCRUTv3 surface datasets when compared with the UAH and RSS lower tropospheric datasets, especially over land areas. This variation in trends is also confirmed by the larger temperature anomalies that have been reported for near surface air temperatures (e.g., Zorita et al., 2008; Chase et al., 2006; 2008, Connolley, 2008). The differences between surface and satellite datasets tend to be largest over land areas, indicating that there may still be some contamination due to various aspects of land surface change, atmospheric aerosols and the tendency of shallow boundary layers to warm at a greater rate [Lin et al., 2007; Esau, 2008; Christy et al., 2009]. Trends in minimum temperatures in northern polar areas are statistically significantly greater than the trends in maximum temperatures over northern polar areas during the boreal winter months.
We conclude that the fact that trends in thermometer-estimated surface warming over land areas have been larger than trends in the lower troposphere estimated from satellites and radiosondes is most parsimoniously explained by the first possible explanation offered by Santer et al. [2000]. Specifically, the characteristics of the divergence across the datasets are strongly suggestive that it is an artifact resulting from the data quality of the surface, satellite and/or radiosonde observations. These findings indicate that the reconciliation of differences between surface and satellite datasets [Karl et al., 2006] has not yet occurred, and we have offered a suggested reason for the continuing lack of reconciliation.”
What our study shows is that maps prepared by NCDC are biased presentations of the surface temperature anomalies. Our new paper Klotzbach et al (2009) provides evidence of the significant error in the global surface temperature trend analyses of NCDC, and well of other centers such as GISS and CRU, due to the sampling of temperatures at just one level near the surface. It is also important to recognize that this is just one error of a number that are in the NCDC, GISS and CRU data sets, as we have summarized in our paper
Pielke Sr., R.A., C. Davey, D. Niyogi, S. Fall, J. Steinweg-Woods, K. Hubbard, X. Lin, M. Cai, Y.-K. Lim, H. Li, J. Nielsen-Gammon, K. Gallo, R. Hale, R. Mahmood, S. Foster, R.T. McNider, and P. Blanken, 2007: Unresolved issues with the assessment of multi-decadal global land surface temperature trends. J. Geophys. Res., 112, D24S08, doi:10.1029/2006JD008229.
See also Pielke Jr.’s guest post on Watts Up With That on that paper here.
Combine these errors due to station issues, global trends are biased by the removal of satellite based ocean temperatures because it is claimed to have a “cold bias” and the ignoring of the 3000 ARGO buoys which provide excellent global coverage because there is no provision to use them operationally in real or near real time (and because they are showing cooling). By allowing their data to show warm biases, the national data centers which all have a vested interest and involvement in the anthropogenic global warming agenda, are providing the fodder the proponents for carbon control - carbon taxes or cap-and-tax in the government and on Wall Street and among the environmental NGOs.