


World Climate Report
How much evidence will it take to quiet the claim that hurricanes are increasing in frequency due to global warming?
Global Warming crusaders are particularly fond of promoting the idea that we are having a profound impact on hurricane activity - they seem to never let an event go unclaimed. At World Climate Report (WCR), we have reviewed dozens of papers from the leading scientific journals presenting scant evidence to support a strong link between global warming and hurricane activity, and we hope you never get bored with these essays.
The literature never sleeps, and yet another major article has appeared recently in a leading journal with results well-suited for our never-ending review of this subject. The authors are Wang, Yang, Ding, Murakami, and Huang - you guessed it, from China, Japan, and the University of Hawaii. The authors report that the research was supported financially by NASA, the National Natural Science Foundation of China, the Ocean University of China, and the Korea Meteorological Administration Research and Development Program. We once again see that many organizations are seriously interested in trends in hurricane activity around the world.
Indeed, Wang et al. begin their article noting “The impact of the rising sea surface temperature (SST) on tropical cyclone (TC) activity is one of the great societal and scientific concerns. With the observed warming of the tropics of around 0.5C over the past 4 to 5 decades, detecting the observed change in the TC activity may shed light on the impact of the global warming on TC activity. Recent studies of the trends in the existing records of hurricane intensity have resulted in a vigorous debate in academic circles. Much of the debates centered on uncertainties of the hurricane intensity records.” Once again, we see scientists acknowledging that yet another “vigorous debate” is ongoing in the climate change world, despite the popular claim that “the debate is over” when it comes to the science of global warming (possibly the most laughable claim we encounter).
The Wang et al. team wanted to assemble tropical cyclone (TC) activity at the global scale noting that “previous studies of the variability of TC activity have mostly dealt with total numbers in individual basins.” They further note “Revealing the coherent global pattern of TC variability is particularly enlightening for understanding primary mechanisms driving the global TC variation.” Wang et al. gathered records for all hurricane ocean basins, and they ultimately chose the period 1965 to 2008 noting “To diminish the number of missing cyclones, we chose the period of examination starting from 1965 when satellite monitoring of weather events became available.”
If you simply glance at their figure below (Figure 1), you see our interest in their work - there is clearly no trend whatsoever in global tropical cyclone activity. In their own words, we learn “Note also that the global storm days do not show any trend over the past 44 years.” We noted!
They further note that the western North Pacific and Southern Hemisphere ocean tropical cyclone “activities, which dominate the global TC activity, have no trend.” They find that the number of storm days is related to global teleconnections, particularly El Nino-Southern Oscillation (ENSO) and the Pacific Decadal Oscillation (PDO), and not to the overall state of global temperatures. They state that “variability of the global total storm days is primarily driven by the ENSO and PDO. Note that the global total has a large amplitude variation with a minimum of 460 days in 1977 TC year and a maximum of 929 days in 1996 TC year. Strong TC activity is seen in 1990s (1990-1997), which is mainly attributed to the changes in the WNP [western North Pacific]and SHO [Southern Hemisphere oceans] TC activity. This decade‐long highly active period concurs with the unprecedented prolonged ENSO event of 1990-1994 and the strongest El Nino episode of 1997 during the last century. The large fluctuation in global storms days is a surprise because the annual number of TC genesis has been thought to be stable owing to the storm‐induced feedback that tends to limit the global number of cyclones that can form each year.”
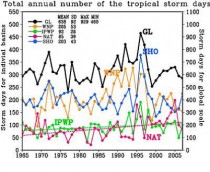
Figure 1. (enlarged here) Time series of the total annual number of tropical storm days during each TC year for the global domain (GL), western North Pacific (WNP), North Atlantic (NAT), and SH ocean (SHO), and Indo‐Pacific Warm Pool (IPWP, 17.5S-10N, 70E -140E). The left‐hand side tick marks are for individual basins (region) and the right hand side are for the global total. The mean numbers and standard deviations, maximum, and minimum are shown in the legend (from Wang et al., 2010).
They finish up concluding
“Over the period of 1965-2008, the global TC activity, as measured by storm days, shows a large amplitude fluctuation regulated by the ENSO and PDO, but has no trend, suggesting that the rising temperature so far has not yet an impact on the global total number of storm days.”
Just imagine if this international team of hurricane scientists had found an upward trend in hurricane activity? They would probably be grand marshals of the Rose Bowl parade, they would need agents to handle their international appearances, and their results would have been featured on 1,000s of websites and news stories the world over. Had they found a substantial decrease, they would have been attacked as puppets of fossil fuel companies and co-conspirators in the oil spill in the Gulf. But they found no trend whatsoever, so they remain in limbo and find themselves only being featured in places like World Climate Report. Stay tuned for more results on the hurricane front - the literature on this subject never ends!
Reference:
Wang, B., Y. Yang, Q.‐H. Ding, H. Murakami, and F. Huang, 2010. Climate control of the global tropical storm days (1965-2008). Geophysical Research Letters, 37, L07704, doi:10.1029/2010GL042487.
See post here.
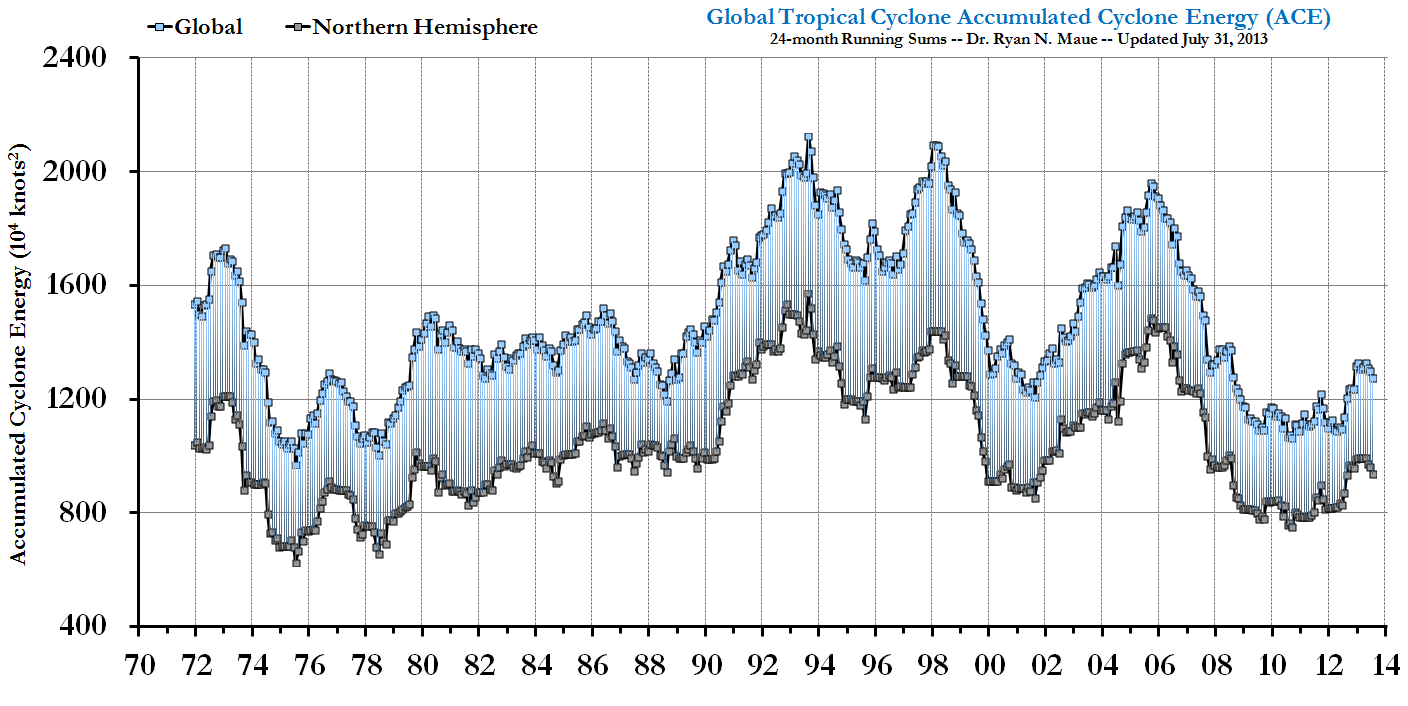
Matches this from Dr. Ryan Maue, FSU
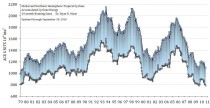
Figure: Global and Northern Hemisphere Accumulated Cyclone Energy: 24 month running sum (enlarged here) through September 30, 2010. Note that the year indicated represents the value of ACE through the previous 24-months for the Northern Hemisphere (bottom line/gray boxes) and the entire global (top line/light blue boxes). The area in between represents the Southern Hemisphere total ACE.