


By Joseph D’Aleo
Tom Karl’s following in James Hansen’s big foosteps. As global warming fizzles, they have taken steps to manipulate the data to make it look like it is still occurring. We reported in June the discontinuity between NOAA projecting the world was the eighth warmest June on record for the globe in the 129 years since records began in 1880. At the same time, the University of Alabama, Huntsville came out with their global June assessment and they reported the 9th coldest in the 30 years of records in their data base. In fact, their global mean was actually below the average (base period 1979-1998) with a value of -0.11C (-0.19F). This is a full 1.1F degrees colder than the NOAA guesstimate. The other NASA satellite source, RSS had June as the 13th coldest out of the last 30 years.
Well NOAA again this month was out of line with the satellite assessment with both the August and summer averages for the lower 48 states. In this press release, NOAA’s National Climate Data Center (NCDC) claimed the June-August 2008 summer season was the 22nd warmest on record for the contiguous United States. Also, last month ended as the 39th warmest August for the contiguous (lower 48) United States, based on records dating back to 1895.
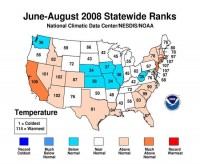
See larger image here.
Compare that with the UAH MSU based satellite depiction for the lower 48 states. They show the United states had the 13th coldest August in 30 years (with an anomaly of 0.05 for the 1979-1998 average). They also show the summer was the 12th coldest in 30 years with a small anomaly of 0.036F.
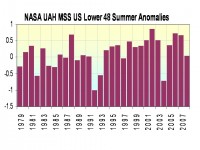
See larger image here.
It is unclear whether the NCDC US assessment already has the NCDC adjustments applied. Most people believe the data used in climate assessments is the data they hear reported each day from the NWS on their local news. In actual fact the data is adjusted by NCDC before it becomes recorded in the official national or global data bases. The older data was changed for changes in time of observation and in some cases (not all) instrumentation. In the original US climate data set, NCDC made adjustments for site changes and urbanization. Last year NCDC replaced the urban heat island and siting adjustments in the original climate data with changes determined by a change point detection algorithm. This change point algorithm looks for sudden discontinuities like occur when a station moves or local land use suddenly changed around the instruments (road is paved, building built) but would not catch the slow warming associated with a slow growth of an urban area (town or city) which is most commonly the case. Anthony Watts has found examples where the algorithms have failed to even find sudden changes due to station moves like Lampasas TX). So it appears NCDC has taken a giant step backwards in trying to provide accurate climate change assessments and forward in supporting the AGW movement which has benefited NOAA budgets. See why urban adjustment is important and why the lack of adjustment is likely responsible for much of the so called warming trend the last century here. See more about the surface station siting issue here. As of last report, 87% of the 554 stations evaluated failed to meet the government’s own criteria and 69% were poor to very poorly sited.
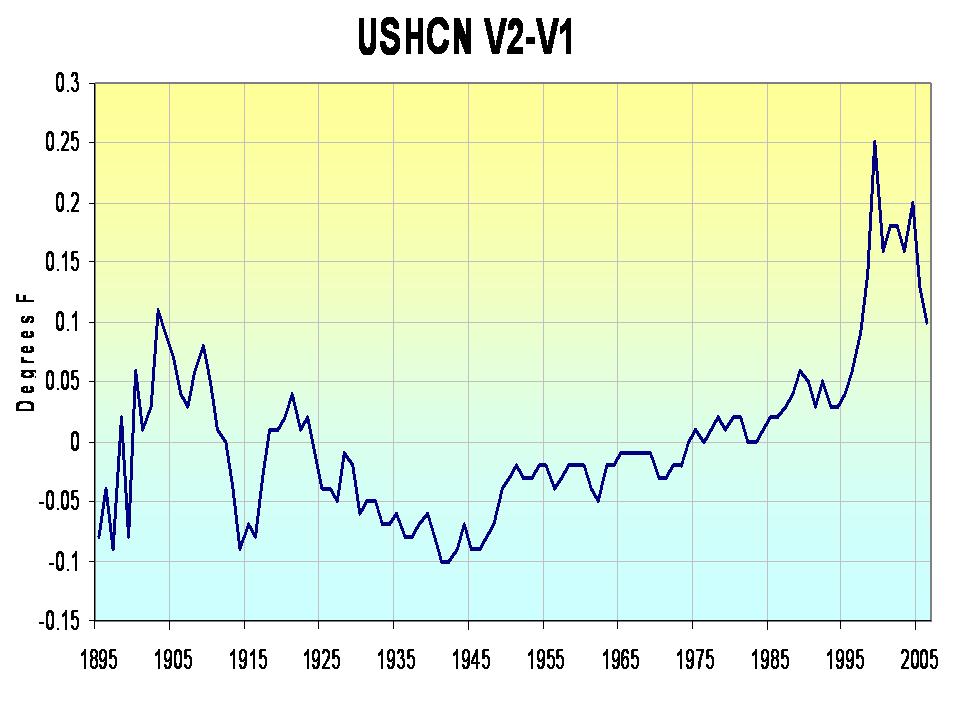
See how the changes in the algorithms affected NOAA NCDC annual temperatures below. Wonder why the 2000s according to NCDC are warm? Man-made global warming but in this case man = NOAA NCDC.
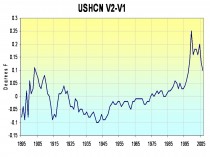
See larger image here
UPDATE: For the globe NOAA claimed 2008 was 0.79 degrees F (0.44 degrees C) above the 20th century mean of 60.1 degrees F (15.6 degrees C) and tied with 1995 for the tenth warmest August on record. The UAH MSU data showed the summer as the 11th coldest in the last 30 years with an anomaly of -0.024C (-0.04F). Again NOAA is an outlier with RSS and MSU. The global data lacks an adequate urban adjustment thanks to the intervention of Tom Peterson who uses a flawed paper to justify his claim that urbanization does not affect global trends. As we have shown in the pdf mentioned above it clearly does. In any case, don’t buy NOAA data. Tom Karl and Tom Peterson deserve to join their counterpart at NASA in retirement (if not in court). They have abused the public trust.