


By Joseph D’Aleo CCM, AMS Fellow
NOAA has as expected announced that June 2009 for the globe was the second warmest June in 130 years, falling just short of 2005. NASA GISS which starts with NCDC GHCN and then adds their own special touches had this June the second warmest on record just behind 1998.
In SHARP contrast, NASA UAH MSU satellite assessment had June virtually normal (+0.001C or 15th coldest in 31 years) and RSS (+0.075C or 14th coldest in 31 years). This is becoming a habit.
NOAA proclaimed May 2009 to be the 4th warmest for the globe in 130 years of record keeping. Meanwhile NASA UAH MSU satellite assessment showed it was the 15th coldest May in the 31 years of its record. This divergence is not new and has been growing. Just a year ago, NOAA proclaimed June 2008 to be the 8th warmest for the globe in 129 years of record keeping. Meanwhile NASA satellites showed it was the 9th coldest June in the 30 years of its record.
We have noted in the last year that NOAA has often become the warmest of the 5 major data sets in their monthly global anomalies. They were second place until they removed the USHCN UHI adjustment in 2007 and introduced a new ocean data set recently.
NOAA and the other ground based data centers would have more credibility if one of the changes resulting in a reduction of the warming trend and not an exaggeration which has been the case each and every time.
THE MANY ISSUES WITH THE STATION BASED DATA CENTERS
NOAA and the other station base data centers suffer from major station dropout (nearly 3/4ths of the stations) many of them rural, there has been a tenfold increase in missing months in remaining stations, no adjustment for urbanization even as the population grew from 1.5 billion to 6.7 billion since 1900 and documented bad station siting for 90% of the observing sites in the United States and almost certainly elsewhere.
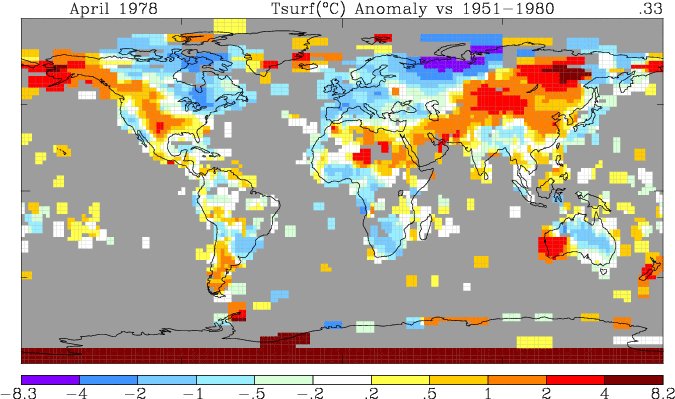
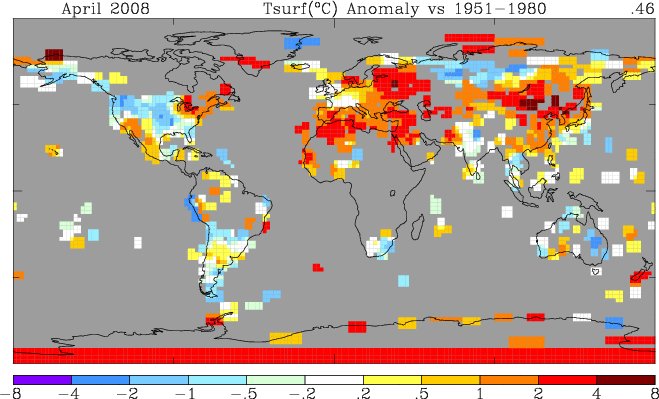
You can see the coverage difference between the stations on this GISS analysis of the NOAA gathered stations from 1978 versus that in 2008.
You can see the stations grow then suddenly disappear in this animation from John W. Goetz on WUWT here. See in today’s John Goetz post 1079 stations worldwide contributed to the GISS analysis, 134 of them being located in the 50 US states. Many, many hundreds of stations that have historically been included in the record and still collect data today continue to be ignored by NOAA and GISS in global temperature calculations (in 1970s the number of stations totaled well over 6000). Data is available in the large holes in places like Canada and Brazil and Africa, but NOAA appears not interested in accessing it. The last year has been very cold in Canada.
Also they in the last year made changes to the ocean temperature data base removing the satellite data that they claimed was giving a cold bias to the data. The oceans now are shown to be warm just about everywhere and was the warmest of the record. See NOAA’s map below and larger here. Note most of the world’s ocean were warmer than normal (for the oceans it was the warmest year). The paper used to justify this ‘improvement’ was co-authored by NOAA chief alarmist (tied maybe with Susan Solomon) Tom Peterson. Peterson’s prior peer review but later debunked work was responsible for the removal of the urban heat island adjustment in 2007 from USHCN.
Compare that with UNISYS’s recent anomaly chart - notice how much of the ocean is cold.
SATELLITE A BETTER WAY
Satellite are widely believed to be the most reliable source of reliable trend information after you calibrate the differences as one bird gets phased out and a new one goes online. UAH and RSS have gotten very good at this in a very cooperative way in recent years. Satellites provide full coverage of the globe including the oceans which cover 70% of the earth’s surface.
When you do a difference in the satellite trends of both UAH and RSS with NOAA NCDC land stations, you see an increasing warm bias in the NOAA data which explains why months with major cold in the news get ranked so high by NOAA and not by the satellite sources. The difference started small in 1979 but is now approaching 0.5C (almost 1F)!.
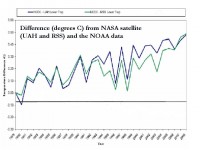
Graph of the difference between NOAA and NASA UAH and RSS (Klotzbach et al 2009). See larger image here.
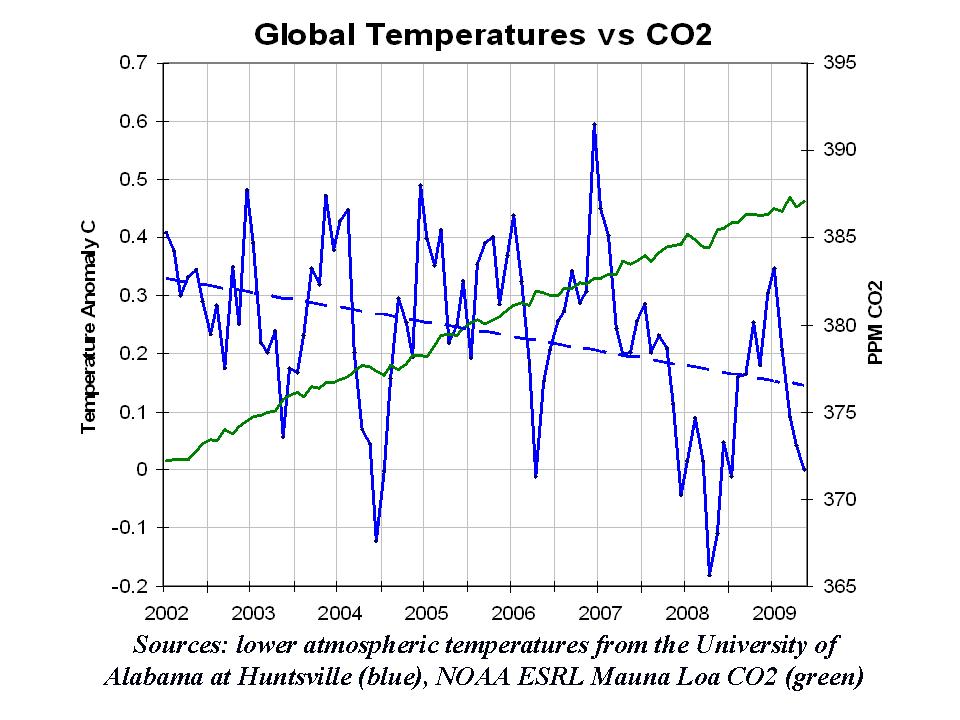
The satellite data is regarded even by NOAA administration to be the most reliable but they don’t use it in releases as it is only available for 30 years. It has shown a cooling since 2002.
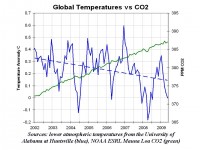
See larger image here.
NCDC’S TOM KARL DISPUTES SATELLITE DATA IN TREND ANALYSIS
This post from Watts Up With That on June RSS data, Anthony mentions how in testimony in March 2009 before congress, NCDC’s director Tom Karl opined about satellite data and the “adjustments” required:
“It is important to note raw satellite data and rapidly produced weather products derived from satellite sensors are rarely useful for climate change studies. Rather, an ordered series of sophisticated technical processes, developed through decades of scientific achievement, are required to convert raw satellite sensor data into Climate Data Records (CDRs).”
Anthony quips “You mean ”sophisticated technical processes” like these performed on raw surface temperature data at NCDC?”
Source here enlarged.
Given NOAA’s efforts to penalize false reporting as this release on the NOAA home page: NOAA Imposes Fine and Penalty for False Reporting in Alaska Fishery July 1, 2009
“A hired master, vessel owners and permit holders of the Alaskan fishing vessel Trident have agreed to pay more than $18,000 in penalties and $241,000 worth of sanctions for falsely reporting areas fished by the vessel on five trips during 2006 and 2007. The violations were detected and investigated by the Alaska division of NOAA’s Fisheries Service Office of Law Enforcement, and the charges were brought by NOAA’s Office of General Counsel.”
NOAA’s OGC should be looking at their own data centers and the architects, Tom Peterson and Tom Karl. See PDF here.