


By Joseph D’Aleo, CCM
Grant Foster has written a book titled “Noise: Lies, Damned Lies, and Denial of Global Warming”. In it Foster, who posts as Tamino, challenges evidence that has been presented to challenge the dominant role of CO2 in climate change. Included in his rants are challenges to some of my graphs and one of Joanne Nova. He never requested or received permission to use my graphs and he cherry picked the charts used to make the case I was cherry picking. In my posting on correlations a few years ago, I did correlations over the entire period of record AND the last decade. Foster argued correlations over short period of a few years are not valid as noise in the climate system can disturb the very clear correlation seen in the longer term.
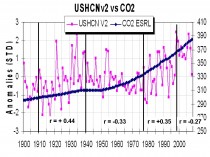
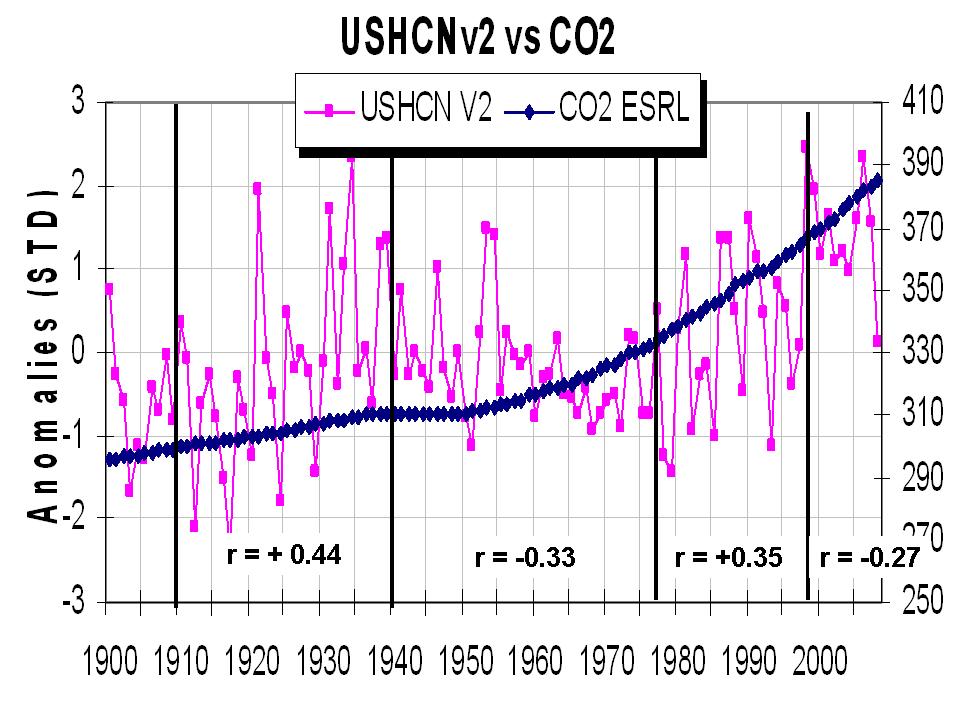
Let us look at the long term. We use the USHCN version 2 here (data is normalized relative to the entire period of record). In the version 2, NCDC removed the UHI adjustment which has introduced a warming trend not in the version 1.
Enlarged here.
The correlation varies in multidecadal fashion - tied to multidecadal variations in the Pacific (PDO).
From 1910 to 1940, the correlation (Pearson coefficient r)) was +0.44. In the period from 1940 to 1979 (40 years - not exactly short-term noise), the correlation turned negative (-0.33). From 1979 to 1998, it turned positive (+0.35). From 1999 to 2009, it turned negative (-0.27). The number of years positive equaled the number of years negative. That hardly makes a strong case for man-made CO2 induced warming.
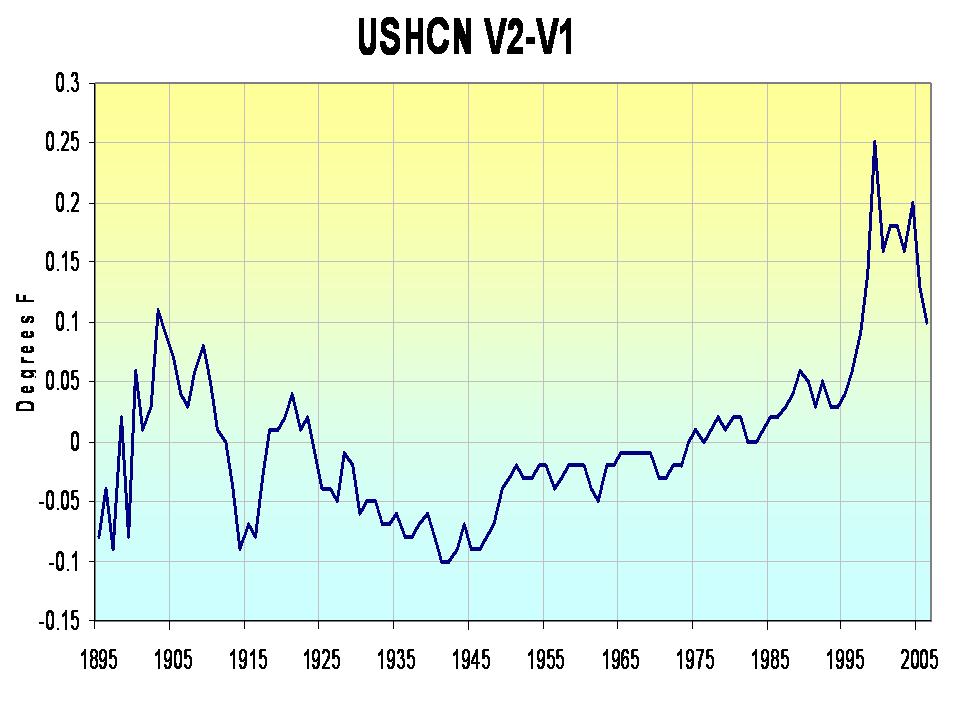
If you look at the changes in USHCN from version 1 to 2 you see, version 2 after the removal of the UHI has increased the warming since 1940 of about 0.25F. The older version would show even more negative correlations in the cooling periods and lower positive in the warming periods.

Enlarged here.
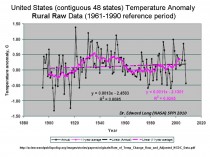
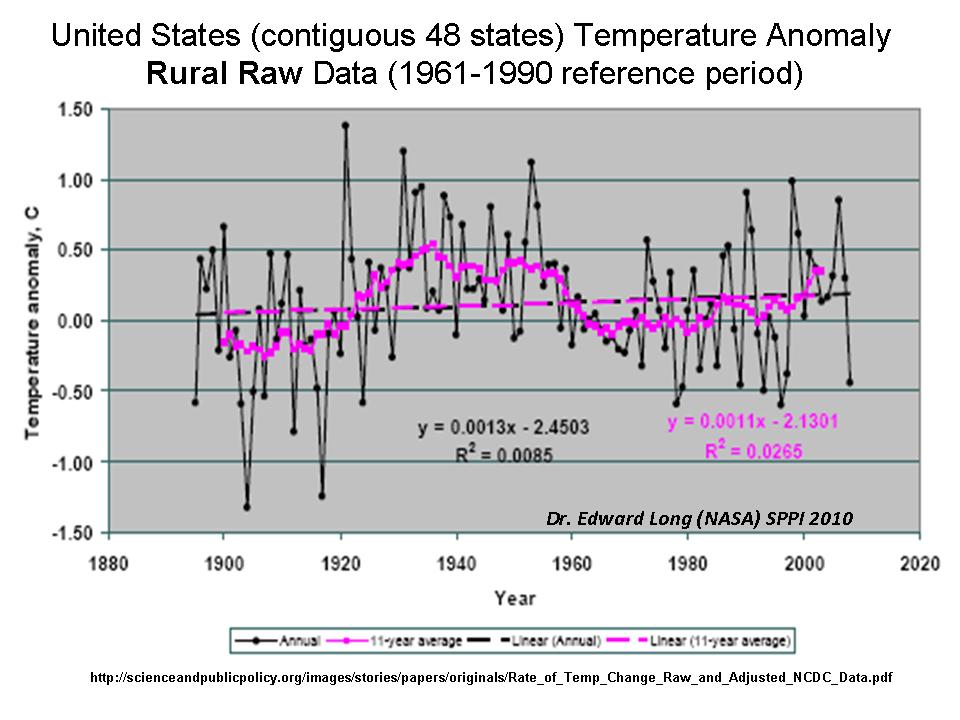
Dr. Ed Long, formerly of NASA, did this analysis for SPPI for representative rural stations (raw NCDC) in the lower 48 states. The running mean shows the 1930s peak and a lower recent maximum. There is a slight long term trend (not statistically significant) up only because the record starts at the cold period and ends at the end of the warm period.
Enlarged here.
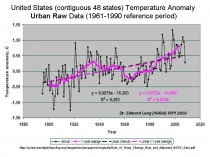
He then did the same for an equal number of urban stations. Here the trend is nearly 1 degree Celsius per century.
Enlarged here.
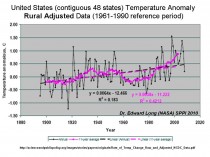
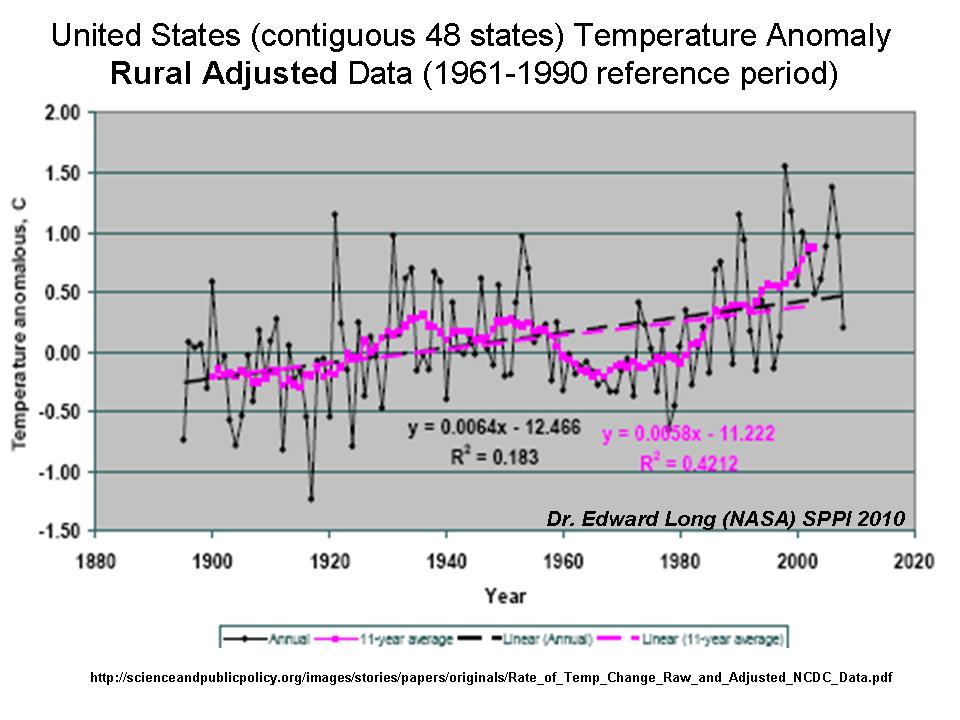
Note that instead of adjusting the urban data to remove the UHI contamination, the NOAA algorithms including homogenization have instead made the rural stations more like the urban producing a warming of 0.75C and a reduced warm blip in the 1930s and an exaggerated one near 2000!
Enlarged here.
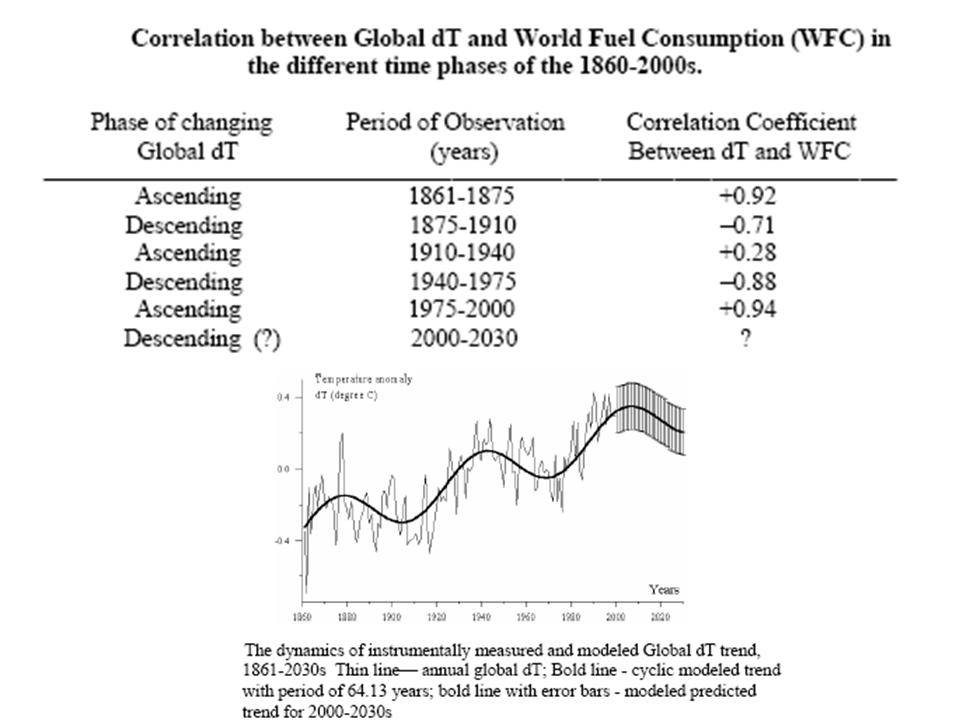
This alternating pattern was also seen by L.B. Klyashtorin and A.A. Lyubushin (2003 paper in Energy & Environment) where they compared world fuel consumption to global temperatures.

Enlarged here.
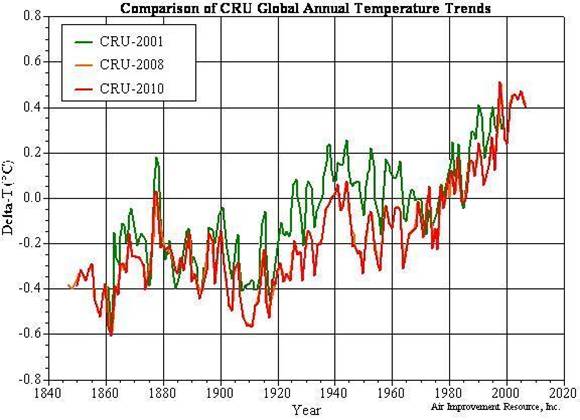
Their correlations would also change if the data was not ‘blended’ and otherwise modified to enhance the hockey stick look as we see with the Hadley from 2001 compared to 2009 (after Loehle).
Enlarged here.
Even in the manipulated data, the 60 year cycle is evident. These cycles suggest other factors like ocean and solar cycles which match these ups and downs are really the dominant climate drivers.
Given that in the 110 years of record during which World Fuel Consumption and CO2 has increased, 55 years warmed and 55 years cooled, a 50% prediction skill. I don’t gamble but I follow sports and hear the occasional ad from a so-called sports betting guru that promises to give you the bettors edge by predicting what teams are best bets to win and beat the spread. What if one of these guys said he was right 50% of the time. Would you part with your money for his forecast system? The CO2 driven models are a failure (despite efforts by NASA scientists to defend them in the most Science article).
See post here. See also the cycles in this post here.