


By Rusty Kapela, WCM, NWS Milwaukee
We took a look at the long-term temperatures observed for Milwaukee, and calculated the number consecutive days with temperatures above 32F - that is, the minimum temperature for any calendar day had to be above the freezing mark of 32F. In a rough sense, we were looking for the number of consecutive days each year that plants had a chance to grow or survive. We found some interesting trends, but in general, there has been a lengthening of the growing season since the 1960s, but we haven’t exceeded what was observed in some of the years during the perod of 1900 to 1934.
Below is a graph of the annual average temperaure for Milwaukee - it also shows an upward trend in recent years. However, keep in mind that the location of the observations moved from the downtown area to Mitchell Field.
Some climate researchers have noted that a good portion of the increase in temperatures in the past couple decades was due to warmer overnight minimum temperatures - in other words night-time temperatures increased more than the daytime temperaures. So, we went back into the record books to count the number of days each year with minimum temperatures at or above 70 F. The hot summer of 1995 really stands out, as well as some of those hot years in the early 1930s. The year of 1921 stands out as well with 34 days with minimum temperatures at or above 70F. The graph below shows the results.
See the story here.
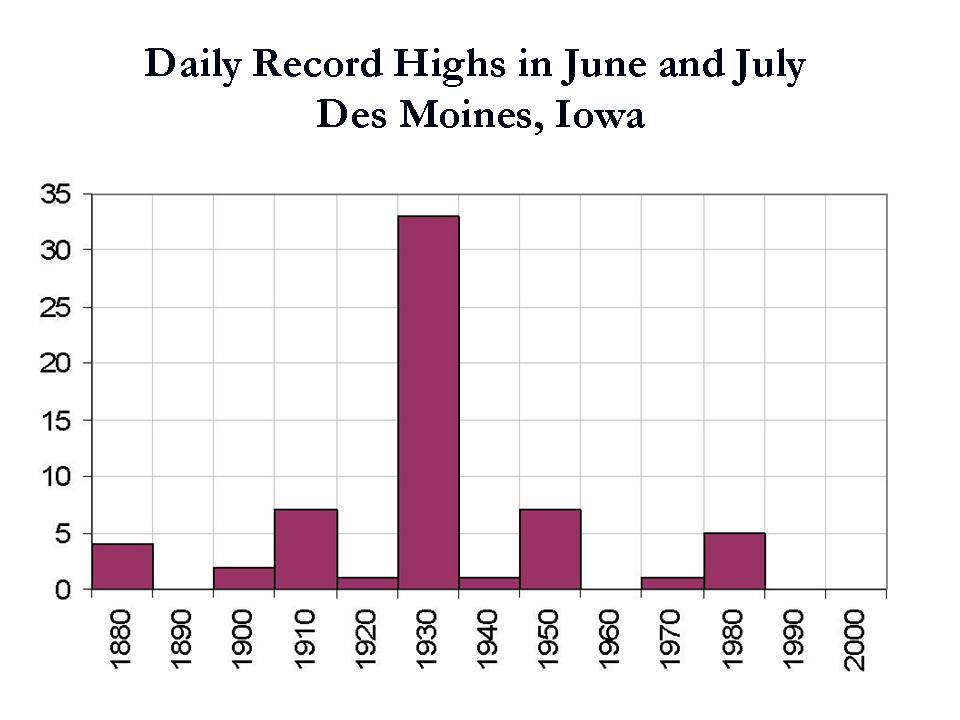
Nicely done guys. Here is the the decadal plot of record highs in June and July for Des Moines, Iowa. Notice the dominance of the 1930s with 33 records out of a possible 61. The most recent 5 records came in the heat wave of 1988. There have been NO records highs since despite the nonsense in the NOAA CCSP and IPCC reports that heat wave frequency is increasing in frequency especially over the continents. You can’t find a more continental location than Des Moines, IA.
********************
Forecasting Global Temperatures
By David Whitehouse
The recent spate of scientific papers that are attempting to predict what the earth’s temperature might be in the coming decades, and also explain the current global temperature standstill, are very interesting because of the methods used to analyse temperature variations, and because they illustrate the limitations of our knowledge.
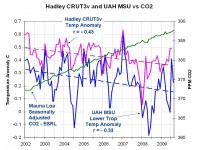
Recall that only one or two annual data points ago many scientists, as well as the most vocal ‘campaigners,’ dismissed the very idea that the world’s average annual temperature had not changed in the past decade. Today it is an observational fact (enlargement of graphic below) that can no longer be ignored. We should also not forget that nobody anticipated it. Now, post facto, scientists are looking for an explanation, and in doing so we are seeing AGW in a new light.
The main conclusion, and perhaps it’s no surprise, to be drawn about what will happen to global temperatures is that nobody knows.
The other conclusion to be drawn is that without exception the papers assume a constantly increasing AGW in line with the increase of CO2. This means that any forecast will ultimately lead to rising temperatures as AGW is forever upward and natural variations have their limits. But there is another way of looking at the data. Instead of assuming an increasing AGW why not look for evidence of it in the actual data. In other words let the data have primacy over the theory.
Lean and Rind try to isolate and analyse the various factors that affect decadal changes in the temperature record; El Nino, volcanic aerosols, solar irradiance and AGW. Their formula that links these factors together into a time series is quite simple (indeed there is nothing complicated about any of the papers looking at future temperature trends) though in the actual research paper there is not enough information to follow through their calculations completely.
El Nino typically produces 0.2 deg C warming, volcanic aerosols 0.3 deg C cooling on short timescales, solar irradiance 0.1 deg C (I will come back to this figure in a subsequent post) and the IPCC estimate of AGW is 0.1 deg C per decade.
It should also be noted that natural forces are able to produce a 0.5 deg C increase, although over a longer period. The 0.5 deg C warming observed between say 1850 and 1940 is not due to AGW.
The temperature increase since 1980 is in fact smaller than the rise seen between 1850 - 1940, approx 0.4 deg C. This took place in less than two decades and was followed by the current standstill. A fact often overlooked is that this recent temperature increase was much greater than that due to the postulated AGW effect (0.1 deg C per decade). It must have included natural increases of a greater magnitude.
This is curious. If the recent temperature standstill, 2002-2008, is due to natural factors counteracting AGW, and AGW was only a minor component of the 1980 -1998 temperature rise, then one could logically take the viewpoint that the increase could be due to a conspiracy of natural factors forcing the temperature up rather than keeping the temperature down post 2002. One cannot have one rule for the period 2002 - 2008 and another for 1980 -1998!
Lean and Rind estimate that 73% of the temperature variability observed in recent decades is natural. However, looking at the observed range of natural variants, and their uncertainties, one could make a case that the AGW component, which has only possibly shown itself between 1980 - 98, is not a required part of the dataset. Indeed, if one did not have in the back of one’s mind the rising CO2 concentration and the physics of the greenhouse effect, one could make out a good case for reproducing the post 1980 temperature dataset with no AGW!
Natural variations dominate any supposed AGW component over timescales of 3 - 4 decades. If that is so then how should be regard 18 years of warming and decades of standstills or cooling in an AGW context? At what point do we question the hypothesis of CO2 induced warming?
Lean and Rind (2009) look at the various factors known to cause variability in the earth’s temperature over decadal timescales. They come to the conclusion that between 2009-14 global temperatures will rise quickly by 0.15 deg C - faster than the 0.1 deg C per decade deduced as AGW by the IPCC. Then, in the period 2014-19, there will be only a 0.03 deg C increase. They believe this will be chiefly because of the effect of solar irradiance changes over the solar cycle. Lean and Rind see the 2014-19 period as being similar to the 2002-8 temperature standstill which they say has been caused by a decline in solar irradiance counteracting AGW.
This should case some of the more strident commentators to reflect. Many papers have been published dismissing the sun as a significant factor in AGW. The gist of them is that solar effects dominated up to 1950, but recently it has been swamped by AGW. Now however, we see that the previously dismissed tiny solar effect is able to hold AGW in check for well over a decade - in fact forcing a temperature standstill of duration comparable to the recent warming spell.
At least the predictions from the various papers are testable. Lean and Rind (2009) predict rapid warming. Looking at the other forecasts for near-future temperature changes we have Smith et al (2007) predicting warming, and Keenlyside et al (2008) predicting cooling.
At this point I am reminded that James Hansen ‘raised the alarm’ about global warming in 1988 when he had less than a decade of noisy global warming data on which to base his concern. The amount of warming he observed between 1980 and 1988 was far smaller than known natural variations and far larger than the IPCC would go on to say was due to AGW during that period. So whatever the eventual outcome of the AGW debate, logically Hansen had no scientific case.
There are considerable uncertainties in our understanding of natural factors that affect the earth’s temperature record. Given the IPCC’s estimate of the strength of the postulated AGW warming, it is clear that those uncertainties are larger than the AGW effect that may have been observed. Read more here.