


By Nir Shaviv, Science Bits
A few days ago I had a very pleasant meeting with Andrew Bolt. He was visiting Israel and we met for an hour in my office. During the discussion, I mentioned that the writers of the recent IPCC reports are not very scientific in their conduct and realized that I should write about it here.
Normal science progresses through the collection of observations (or measurements), the conjecture of hypotheses, the making of predictions, and then through the usage of new observations, the modification of the hypotheses accordingly (either ruling them out, or improving them). In the global warming “science”, this is not the case.
What do I mean?
From the first IPCC report until the previous IPCC report, climate predictions for future temperature increase where based on a climate sensitivity of 1.5 to 4.5C per CO2 doubling. This range, in fact, goes back to the 1979 Charney report published by the National Academy of Sciences. That is, after 33 years of climate research and many billions of dollars of research, the possible range of climate sensitivities is virtually the same! In the last (AR4) IPCC report the range was actually slightly narrowed down to 2 to 4.5C increase per CO2 doubling (without any good reason if you ask me). In any case, this increase of the lower limit will only aggravate the point I make below, which is as follows.
Because the possible range of sensitivities has been virtually the same, it means that the predictions made in the first IPCC report in 1990 should still be valid. That is, according to the writers of all the IPCC reports, the temperature today should be within the range of predictions made 22 years ago. But they are not!
The business as usual predictions made in 1990, in the first IPCC report, are given in the following figure.
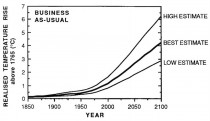
The business-as-usual predictions made in the first IPCC report, in 1990. Since the best range for the climate sensitivity (according to the alarmists) has not changed, the global temperature 22 years later should be within the predicted range. From this graph, we take the predicted slopes around the year 2000.
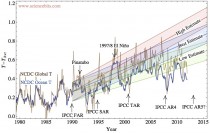
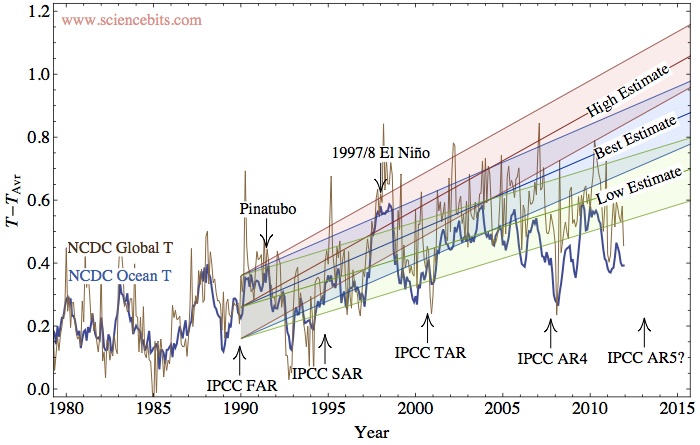
How well do these predictions agree with reality? In the next figure I plot the actual global and oceanic temperatures (as made by the NCDC). One can argue that either the ocean temperature or the global (ocean+land) temperature is better. The Ocean temperature includes smaller fluctuations than the land (and therefore less than the global temperature as well), however, if there is a change in the average global state, it should take longer for the oceans to react. On the other hand, the land temperature (and therefore the global temperature) is likely to include the urban heat island effect.
>
Enlarged
The NCDC ocean (blue) and global (brown) monthly temperature anomalies (relative to the 1900-2000 average temperatures) since 1980. The observed temperatures compared to the predictions made in the first IPCC report. Note that the width of the predictions is ±0.1°C, which is roughly the size of the month to month fluctuations in the temperature anomalies.
From the simulations that my student Shlomi Ziskin has carried out for the 20th century, I think that the rise in the ocean temperature should be only about 90% of the global temperature warming since the 1980’s, i.e., the global temperature rise should be no more than about 0.02-0.03°C warmer than the oceanic warming (I’ll write more about this work soon). As we can see from the graph, the difference is larger, around 0.1°C. It would be no surprise if this difference is due to the urban heat island effect. We know from McKitrick and Michaels’ work, that there is a spatial correlation between the land warming and different socio-economic indices (i.e., places which developed more, had a higher temperature increase). This clearly indicates that the land data is tainted by some local anthropogenic effects and should therefore be considered cautiously. In fact, they claim that in order to remove the correlation, the land warming should be around 0.17°C per decade instead of 0.3. This implies that the global warming over 2.2 decades should be 0.085°C cooler, i.e., consistent with the difference!
In any case, irrespective of whether you favor the global data, or the oceanic data, it is clear the the temperature with its fluctuations is inconsistent with the “high estimate” in the IPCC-FAR (and it has been the case for a decade if you take the oceanic temperature, or half a decade, if you take the global temperature, not admitting that it is biased). In fact, it appears that only the low estimate can presently be consistent with the observations. Clearly then, earth’s climate sensitivity should be revised down, and the upper range of sensitivities should be discarded and with it, the apocalyptic scenarios which they imply. For some reason, I doubt that the next AR5 report will consider this inconsistency, nor that they will revise down the climate sensitivity (and which is consistent with other empirical indicators of climate sensitivity). I am also curious when will the general public realize that the emperor has no clothes.
Of course, Andrew commented that the alarmists will always claim that there might be something else which has been cooling, and we will pay for our CO2 sevenfold later. The short answer is that “you can fool some of the people some of the time, but you cannot fool all of the people all of the time!” (or as it should be adapted here, “you cannot fool most of the people indefinitely!”).
The longer answer is that even climate alarmists realize that there is a problem, but they won’t admit it in public. In private, as the climate gate e-mails have revealed, they know it is a problem. In October 2009, Kevin Trenberth wrote his colleagues: “
The fact is that we can’t account for the lack of warming at the moment and it is a travesty that we can’t. The CERES data published in the August BAMS 09 supplement on 2008 shows there should be even more warming: but the data are surely wrong. Our observing system is inadequate. ”
However, instead of reaching the reasonable conclusion that the theory should be modified, the data are “surely wrong”. (This, btw, is a sign of a new religion, since no fact can disprove the basic tenets).
When you think of it, those climatologists are in a rather awkward position. If you exclude the denial option (apparent in the above quote), then the only way to explain the “travesty” is if you have a joker card, something which can provide warming, but which the models don’t take into account. It is a catch-22 for the modelers. If they admit that there is a joker, it disarms their claim that since one cannot explain the 20th century warming without the anthropogenic contribution, the warming is necessarily anthropogenic. If they do not admit that there is a joker, they must conclude (as described above) that the climate sensitivity must be low. But if it is low, one cannot explain the 20th century without a joker. A classic Yossarian dilemma.
This joker card is of course the large solar effects on climate.