


Syun-Ichi Akasofu
ABSTRACT
A number of published papers and openly avail-able data on sea level changes, glacier retreat, freezing/break-up dates of rivers, sea ice retreat, tree-ring observations, ice cores and changes of the cosmic-ray intensity, from the year 1000 to the present, are studied to examine how the Earth has recovered from the Little Ice Age (LIA). We learn that the recovery from the LIA has proceeded continuously, roughly in a linear manner, from 1800-1850 to the present.
The rate of the recovery in terms of temperature is about 0.5C/100 years and thus it has important im-plications for understanding the present global warming. It is suggested, on the basis of a much longer period data, that the Earth is still in the process of recovery from the LIA; there is no sign to indicate the end of the recovery before 1900. Cosmic-ray intensity data show that solar activity was related to both the LIA and its recovery.
The multi-decadal oscillation of a period of 50 to 60 years was superposed on the linear change; it peaked in 1940 and 2000, causing the halting of warming temporarily after 2000. These changes are natural changes, and in order to determine the contribution of the manmade greenhouse effect, there is an urgent need to identify them correctly and accurately and remove them from the present global warm-ing/cooling trend.
Enlarged here.
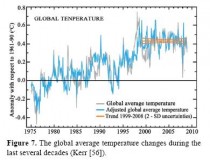
In Section 3, we suggested that the prominent ‘fluctuations’ superposed on the linear recovery are the multi-decadal oscillation. Figure 4(d) shows its rate of changes. From Figures 4(c) and 4(d), the multi-decadal oscillation peaked in 1940, and the temperature actually decreased from the level of the linear increase from 1940 to 1975 and then increased after 1975 to 2000.
Thus, it may be speculated that the situation in 2000 is similar to that in 1940, so that it is predicted that the temperature change will be flat or in a slightly declining trend during the next 30 years or so (see Section 6 and Figure 9). That is to say, the halting does not mean the end of the recov-ery from the LIA. The halting after 2000 can be ob-served in sea level change (Nerem et al), a decrease of the heat content of the oceans (Pielke, Sr.) and other factors.
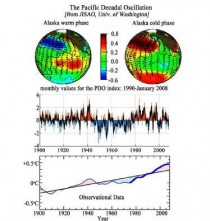
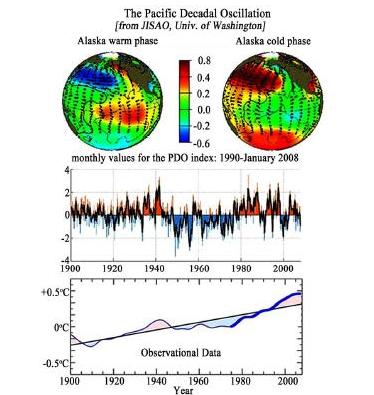
The multi-decadal oscillation can be seen in other phenomena. Figure 8 shows the pattern of the Pacific Decadal Oscillation (PDO), which is a natural phe-nomenon (University of Washington. Top part shows the observed wind pattern over the Pacific Ocean. The middle part shows the PDO index. It is interesting to note a striking resemblance of changes between PDO and the multi-decadal oscillation (at the bottom, Figure 4(c) is reproduced for comparison.). Although there is some phase difference between them, this similarity supports the inference that the fluctuations superposed on the linear change (the recovery from the LIA) are in part the multi-decadal oscillation. The Pacific Ocean is large enough to contribute to the global average tem-perature. Polyakov et al. showed that the Arctic Ocean shows a similar trend.
Enlarged here.
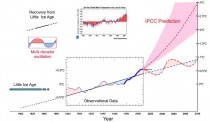
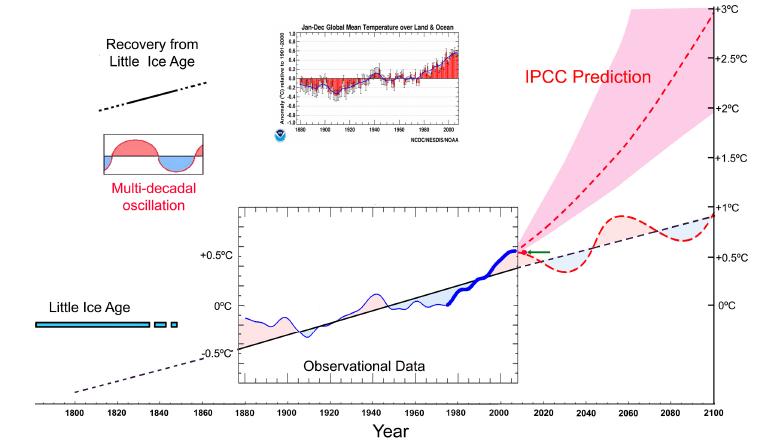
Figure 9. Enlarged here. The figure shows that the linear trend between 1880 and 2000 is a continuation of recovery from the LIA, together with the superposed multi-decadal oscillation. It shows also the predicted temperature rise by the IPCC after 2000. It is as-sumed that the recovery from the LIA would continue to 2100, together with the superposed multi-decadal oscillation. This view could explain the halting of the warming after 2000. The observed temperature in 2008 is shown by a red dot with a green arrow. It has been suggested by the IPCC that the thick blue line portion was caused mostly by the greenhouse effect, so their future prediction is a sort of extension of the blue line.
CONCLUSIONS
In this paper we learned:
1) The Earth experienced the Little Ice Age (LIA) between 1200-1400 and 1800-1850. The temperature during the LIA is expected to be 1C lower than the pre-sent temperature. The solar irradiance was relatively low during the LIA.
2) The gradual recovery from 1800-1850 was ap-proximately linear, the recovery (warming) rate was about 0.5C/100 years. The same linear change continued from 1800-1850 to 2000. In this period, the solar irradiance began to recover from its low value during the LIA.
3) The recovery from the LIA is still continuing today.
4) The multi-decadal oscillation is superposed on the linear change. The multi-decadal oscillation peaked in about 1940 and also in 2000, causing the temporal halt-ing of the recovery from the LIA.
5) The negative trend after the peak in 1940 and 2000 overwhelmed the linear trend of the recovery, causing the cooling or halting of warming.
6) The view presented in this paper predicts the temperature increase in 2100 to be 0.5C plus/minus 0.2C, rather than 4C plus/minus 2.0C predicted by the IPCC.
PDF open accessible here.