By George Taylor
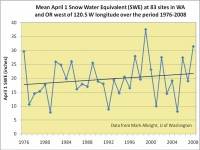
Washington Governor Gregoire recently sent a letter to the Washington House delegation in which she stated that the snow pack has declined 20% over the past 30 years: “Last month, a study released by the University of Washington shows we’ve already lost 20% of our snow pack over the last 30 years.”
Actual snow pack numbers show a 22% INCREASE in snow pack over the past 33 years across the Washington and Oregon Cascade Mountains:

Larger image here. See post here.
ICECAP NOTE: In this story on Sustainable Oregon, George shows how choosing start and end dates makes all the difference in trend analysis. This is true because precipitation trends in the northwest are linked to the PDO cycle of 60 or so years. In the cold phase, La Ninas and heavy snowpacks are common (like the last two years) and in the warm phase, El Ninos and drier winters (as was the case from the 1970s to late 1990s). By cherry picking his start data as 1950 at the very snowy start of the cold PDO phase from 1947 to 1977 and ending in 1997 at the end of the drier warm PDO phase from 1979 to 1998, Mote was able to extract a false signal which he attributed to man made global warming.
Arguing this point made George Taylor, state climatologist for decades in Oregon a target (he took early retirement) and cost the assistant state climatologist in Washington, Mark Albright, his job. Phil Mote, the alarmist professor and author of a discredited work on the western snowpack for the Bulletin of the American Meteorological Society doesn’t accept criticism lightly. He ironically was appointed to the state climatologist position George Taylor held in Oregion. It was Phil who fired Mark for challenging his findings. That is the way it is in the university climate world today, real data doesn’t matter so don’t bother to look and if you need to work with data, pick and choose carefully. Anyone who disagrees publically and risks funding need look elsewhere for employment.
George shows the 1950 to 1997 trend and the longer term trend analysis for several stations with good records showing no discernible long term trends. Mote, whose Ph.D. is from the University of Washington, surmises that Taylor is guilty of looking only at data that support his views, while discarding the rest. “You can only come to that conclusion if you handpick the climate records,” Mote says. Willamette Week, August 24th, 2005
The story doesn’t end there as this post by Jeff ID called SNOWMEN tells, another climate schiester, Eric Steig who made the headline last year when he worked with Michael Mann, the king of data manipulation and cherrry-picking to eliminate the antarctic cooling of the last several decades. Eric chimed in against Taylor and Albright defending Mote and making false or at least uninformed claims about trends. It is clear from Steig’s Real Climate post never even looked at the whole data trends. Jeff correctly notes “These plots are of specific stations, however they demonstrate that at least for the above locations the 1950-1997 trend is a cherry pick, nothing more.”
Unfortunately thess bad analysis has gotten people promoted and been used by state governments to make unwise decisions like supporting the flawed and costly and totally unnecessary WCI (Western Climate Initiative), which Paul Chesser writes about in this American Spectator story here. Climate alarmists like Mann, Mote and Steig and agenda driven politicians like Gregoire have a lot to answer for, if the governments measures inflict major pain on the citizens and the globe continues to cool in its natural rythym.
See Paul Chesser’s follow-up story on the Governor’s use/misuse of this faulty information to move forward her agenda despite the legislature’s opposition here.


