


By Joseph D’Aleo, CCM
In 2002, I was in addition to doing R&D correlations on climate teleconnections for our statistical models at WSI, I was Dr. Dewpoint on Intellicast, in essence an early weblog. This article from the library in 2002 on Why Tracking Climate Change is Like Tracking the Stock Market was prophetic as it predicted the downturn in temperatures we have seen since 2002.
Written March 12, 2002
Those of you who invest in stocks or funds have felt the joy and pains of the market’s ups and downs in recent years. Stock experts point to a number of different factors to explain why the market has moved in a particular direction. They also use these factors and forecasts of these factors to predict where the market will be going and to recommend whether to buy or sell. Not all economists agree on what factors are at play and they often vary greatly in their opinion about what will happen.
THE STOCK MARKET
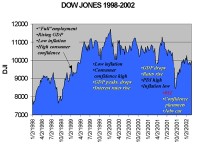
I thought it might be instructive to look at the recent changes in the Dow Jones Index in the last 5 years in relation to the factors. I am not an economist and don’t claim to be a financial expert (though my dad was a financial newspaper and magazine editor of some note).
First note the rapid rise from below 8000 in October 1998 to over 11,000 just 6 months later in the spring and summer of 1999. During that time, many factors were lined up positive including a strong technology driven economy with rising GDP, very low unemployment, low inflation and a very high consumer confidence level.
During the year 2000, the market peaked and then treaded water as some of the factors turned negative. Even as some factors pointed to a down market, others like high personal disposable income and low inflation and relatively high consumer confidence levels kept it from a big correction. Then came 911, a greatly destabilizing event and a real shock to the economic system. Markets plunged, as did the consumer confidence. Unemployment increased as companies attempted to cut costs and improve profitability. The Fed reacted by forcing interest levels down to historically low levels. This together with other stimuli started a rebound and today we are back within 10% or so of the peak (larger image here).
This is not unlike climate change, which goes through ups and downs as the climate factors go through their cycles. Climatologists use the factors to explain the ups and downs and predict where the climate is going. Again not all climatologists agree about what factors are behind the changes and what the future holds for our climate.
There are also some underlying trends. Stocks have risen over the long term, in part because of inflation. If you factor in inflation, the rise is smaller and you more clearly see the cycles of bull and bear markets. In the climate too there are trends. Global temperatures have been rising over the last century. When you factor in factors such as the urban heat island, you find a much smaller rise and the cycles become more obvious.
When we look at the long-term temperature trends for the United States (courtesy of the NCDC), we find many ups and downs on a short term, and we see evidence of long-term trends and cycles.
A close-up examination would show many of the short terms swings are due to El Nino and La Nina cycles (here). Occasionally short-lived shocks to the system like major volcanic eruptions (e.g. Pinatubo 1991) take place with widespread cooling that lasts a few years.
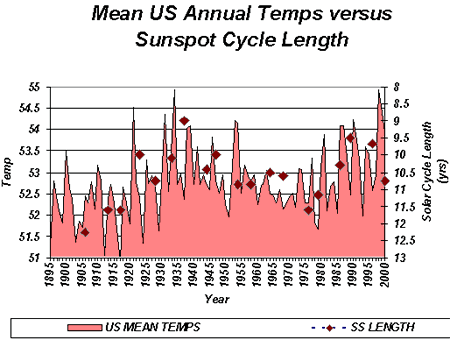
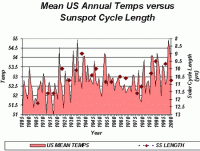
In addition there are factors that control the long-term tendencies and trends. In the chart below you can see one apparent relationship between the length (and strength) of the solar cycle (diamonds) and annual mean temperatures. During periods of strong, short cycles, we see warmer temperatures and during periods with longer, weaker cycles, we find a cooling.
Note that much like the factors in the stock market, when the various factors were all in the warm phase (as they were from around 1920 to near 1950 and again from the very late 1970s to the late 1990s) temperatures tended to be higher. When the factors were all aligned in their cold phase (as they were from the 1950s through the middle 1970s), temperatures fell.
At the end of the cold phase in the late 1970s, three incredibly cold winters caused many to believe that an “Ice Age” was returning. This is like the flurry of experts we see on television during a market free-fall that tell us that “no end is in sight” and that the market had a long way to go “down”. Many experienced investors see this as a buying opportunity. Similarly during the boom times in the stock market, many experts are heard to promise “no end in sight to the bull market”. Many investors will be selling as they see the factors begin to weaken.
Now we appear to be at the end of the warm cycle. Already, the PDO and NAO cycles seem to have shifted to the start of their cold phases. There is also some evidence in this current cycle which has been longer and at least in terms of the sunspot numbers, weaker than the prior two cycles, suggesting it too is shifting into a colder mode. Now we are hearing “gloom and doom” reports of runaway global warming.
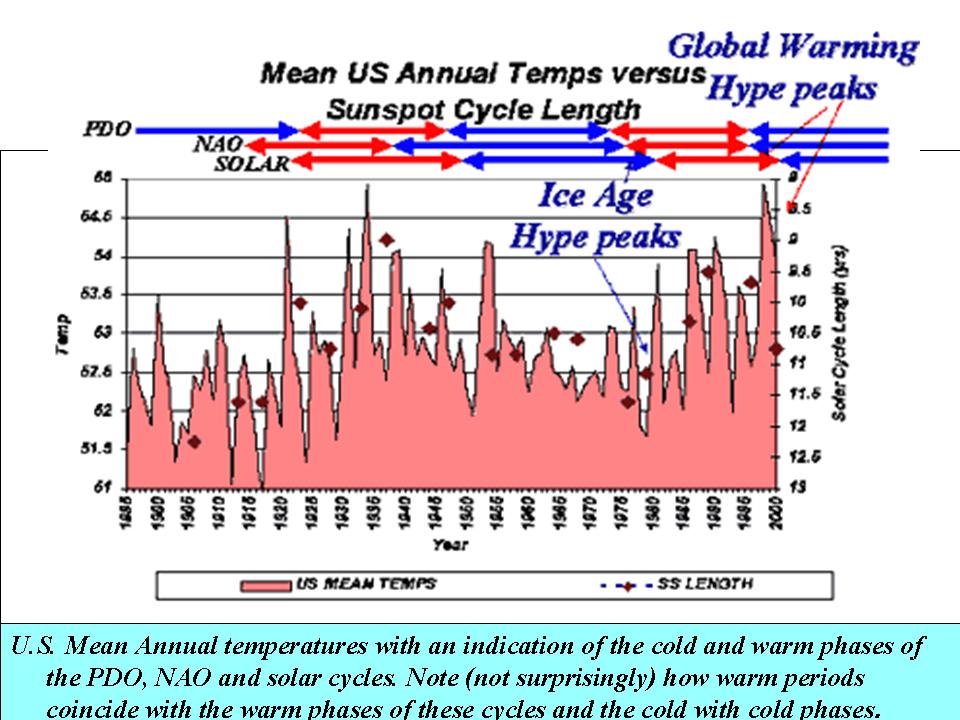
We have also discussed in recent stories how the oceans play a role through decadal scale shifts in circulations and positions of warm and cool pools. This affects the frequency of El Nino and La Nina and tropical and winter storms. These tend to cause changes in atmospheric patterns over the globe and through them affect the surface temperature trends. In the following version, we have added the Pacific and Atlantic cycles (both warm and cold phases to the solar cycles).
In the chart below we show U.S. Mean Annual temperatures with an indication of the cold and warm phases of the PDO, NAO and solar cycles. Note (not surprisingly) how warm periods coincide with the warm phases of these cycles and the cold with cold phases.
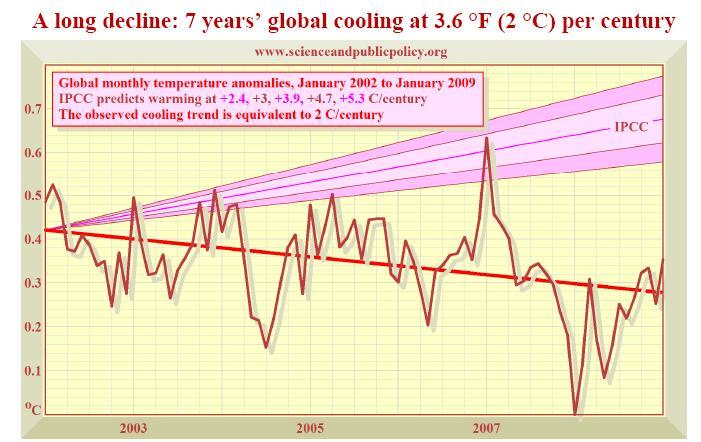
Given the apparent changes in the three factors, if I owned global warming stock, I would sell now. See full story here. Note this cycle (23 min to min) will be at least 12.5 years and the PDO is strongly negative.