


In a HUFFPO piece last week, meteorologist Paul Douglas - a self proclaimed Christian and a republican and “began investigating climate science, and, over time, began to see the thumbprint of climate change—along with “… 97% of published, peer-reviewed PhD’s, who link a 40% spike in greenhouse gases with a warmer, stormier atmosphere.”
Of course that 97% claim, made so often is a bogus study based on what ended up being the opinion of just 79 scientists on whether the globe was warmer than 1800 (the mini ice age) abd whether man played a role in climate change. Most all skeptics would have voted yes as surely we are not in a mini ice age (though could be sooner than we think) and man does have a very measurable affect on local climate (microclimate) through urbanization.
He found these NOAA charts especially convincing and credited ultra leftist Jeff Masters of the “Weather Underground” (named after the Alinsky Doerr radical 1960s group) for his interpretation.
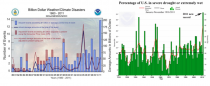
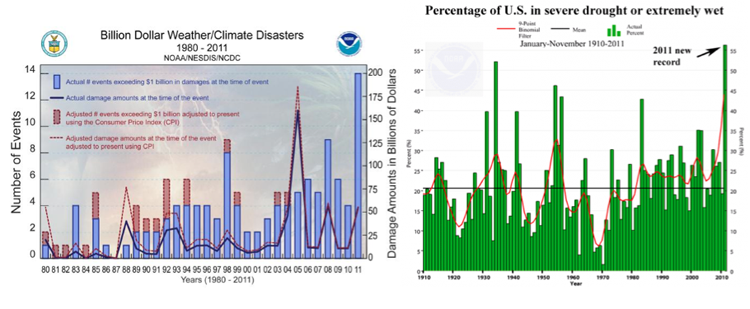
Roger responded to the graph on the left that shows billion dollar disasters
The National Oceanic and Atmospheric Administration is a federal agency that does a lot of excellent work related to weather, climate and the oceans. In fact, it is the primary sponsor of CIRES here at the University of Colorado where I serve as a Fellow. However, NOAA has been publishing information related to disasters that is extremely misleading and scientifically inaccurate.
The graph above shows NOAA’s tally of “billion dollar disasters” which NOAA defines as “the 1980-2005 events which resulted in at least $1 billion in overall damages/costs at the time of the event” (emphasis added, source here in PDF). The bolded part of that sentence is where NOAA’s methodology has a serious flaw, as $1 billion does not mean the same thing today as it did in 1980. In fact, adjusting just for inflation means that $1 billion today would have been the equivalent of $400 million in 1980. And that is not all, because there has been considerable development across the nation since 1980, meaning that there is more property and wealth to be damaged, $1 billion in damage today is actually equivalent to about $170 million in 1980.
Events which would have caused $1 billion in damage today, but did not when they occurred are not included in the NOAA listing. So by focusing on a $1 billion threshold, as $1 billion comes to represent less and less over time, NOAA has built in a strong bias in their analysis which creates the illusion of trend. If the point of the analysis is to say something about trends in weather, it will always be better to look at weather data, not damage data.
He concludes:
Regardless, of whether the total is 4 or 9 missed events or somewhere in the middle, NOAA’s data misses at least 80% of the billion dollar disasters in 1980. Not good. No doubt that a reanalysis of the years 1981 to present would turn up many more such events that failed to meet the contemporary billion-dollar threshold but would certainly do so today.
It is extremely misleading to use economic impacts as the basis for making claims about weather and climate. NOAA should take immediate steps to improve the scientific quality of its tabulation of “billion dollar disasters” lest it find itself accused of misleading the public and decision makers with scientifically unsound information
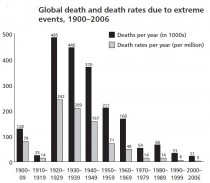
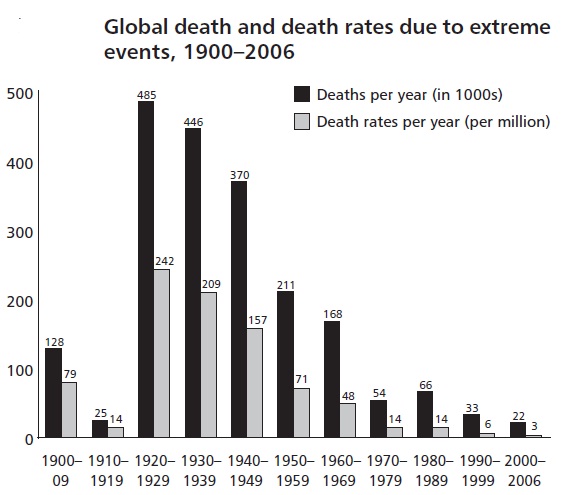
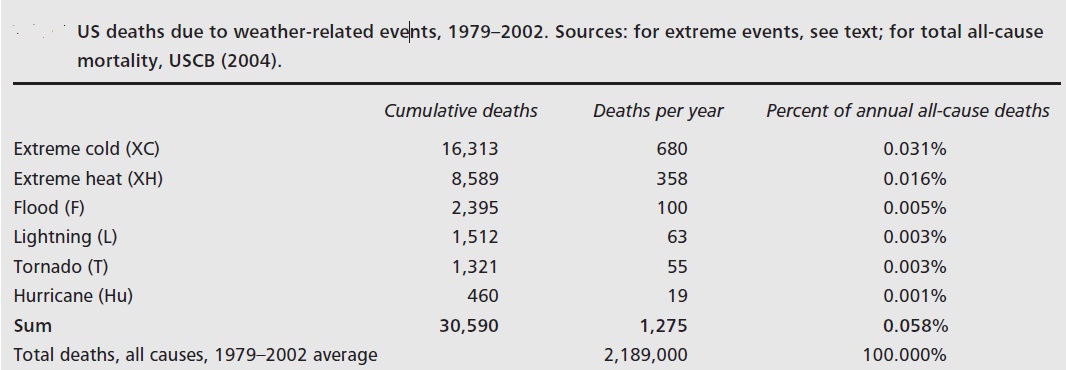
Also Indur Glokany in a study in 2007 showed death rates from extremes of weather were declining and COLD was the bisggest killer.
-----------
The chart on the right is correct but has precious little to do with CO2. Floods and droughts are characteristic of La Ninas especially those in the cold PDO. Last year’s La Nina was the second strongest in the records going back to 1900 and the PDO was deep in its cold mode. We predicted the floods, droughts and tornadoes months in advance.
Among the disasters were the tornadoes. Masters has shown the graph showing 2012 as the peak tornado year, proof in the pudding that we are responsible by driiving our SUVs and burning fossil fuels instead of using bird cuisinards.
Well NOAA’s Storm preciction Center has completed their analysis of 2012 tornado season and Paul Homewood wrote this excellent summary.
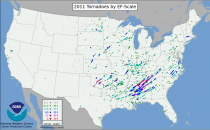
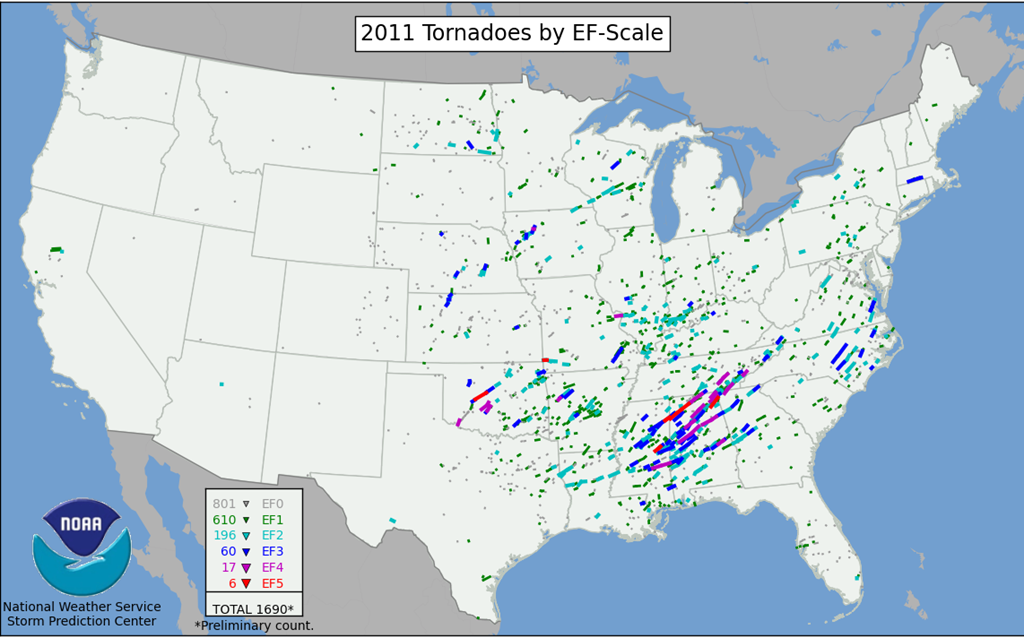
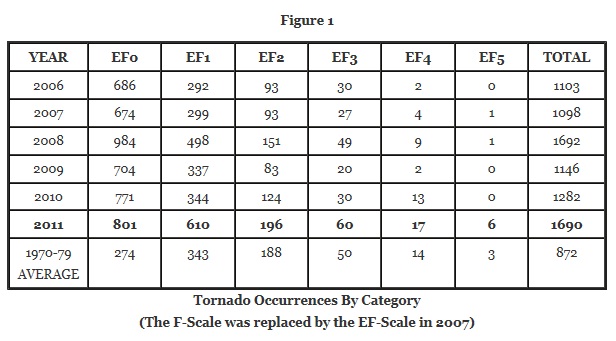
NOAA have just about finalised their numbers for the 2011 tornado season, although December figures still await confirmation. (It usually takes about three months to confirm the provisional reports as each tornado report has to be physically assessed by NWS personnel, in order to determine the category and, in many cases, even decide whether a tornado has actually occurred). So let’s take a look at the figures, as they stand currently.
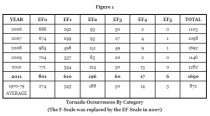
Enlarged
Tornado Occurrences By Category
(The F-Scale was replaced by the EF-Scale in 2007)
Historical Trends
When observing long term trends, it is important to remember that considerable changes have been made to the way that tornadoes are reported. NOAA have this to say :-
Improved tornado observation practices have led to an increase in the number of reported weaker tornadoes, and in recent years the number of EF0 and EF1 tornadoes have become more prevalent in the total number of reported tornadoes.
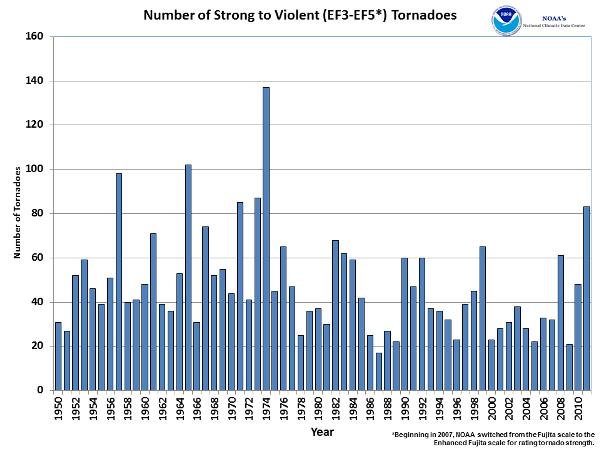
With increased national Doppler radar coverage [introduced between 1992 and 1997], increasing population, and greater attention to tornado reporting, there has been an increase in the number of tornado reports over the past several decades. This can create a misleading appearance of an increasing trend in tornado frequency. To better understand the true variability and trend in tornado frequency in the U.S., the total number of strong to violent tornadoes (EF3 to EF5 category on the Enhanced Fujita scale) can be analyzed. These are the tornadoes that would have likely been reported even during the decades before Doppler radar use became widespread and practices resulted in increasing tornado reports. The bar chart below indicates there has been little trend in the frequency of the strongest tornadoes over the past 55 years.

Enlarged
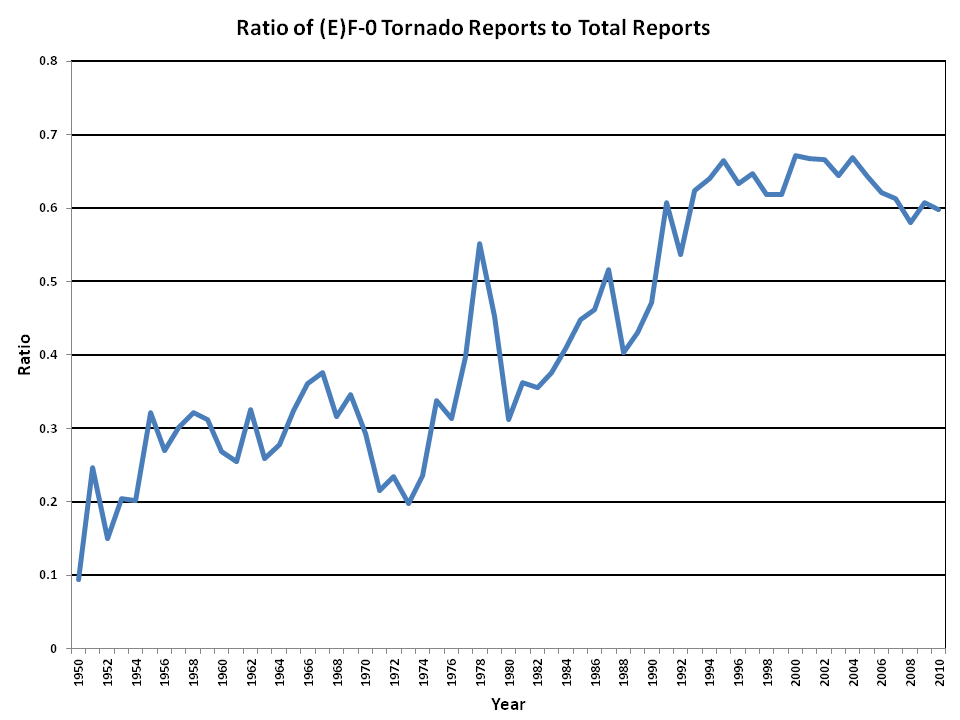
The effect of changes in observation can be clearly seen when looking at the ratio of the weakest F0 tornadoes to total numbers back to 1950, which rises from 10% to 60%.
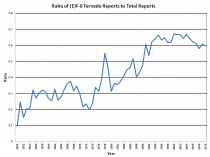
Enlarged
Further background to this issue can be seen here.
Analysis By Category
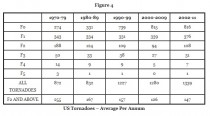
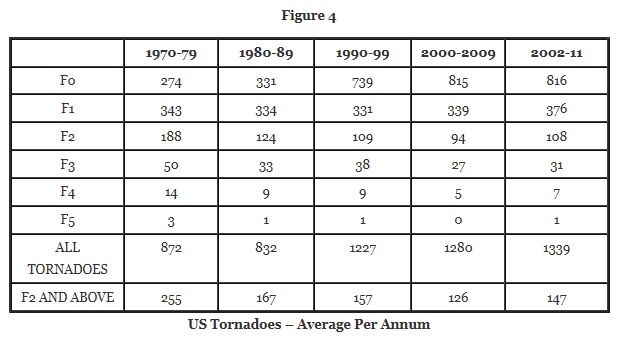
Figure 4 Enlarged
US Tornadoes - Average Per Annum
When the weaker tornadoes are excluded, it is clear that there is very little trend since the 1980’s. It is also very apparent that tornado occurrences were much higher in all categories of F2 and above during the 1970’s, than in the decades since.
Even in 2011, the total of F2+ tornadoes, which amounted to 279, was only slightly above the average of 255 for the whole 1970-79 period.
Are Tornadoes Becoming More Extreme?
In overall terms, Figure 2 indicates that for F3+ categories, 2011 ranked only 6th worst since 1950. But is there any trend towards the most severe categories?
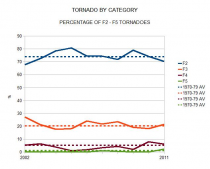
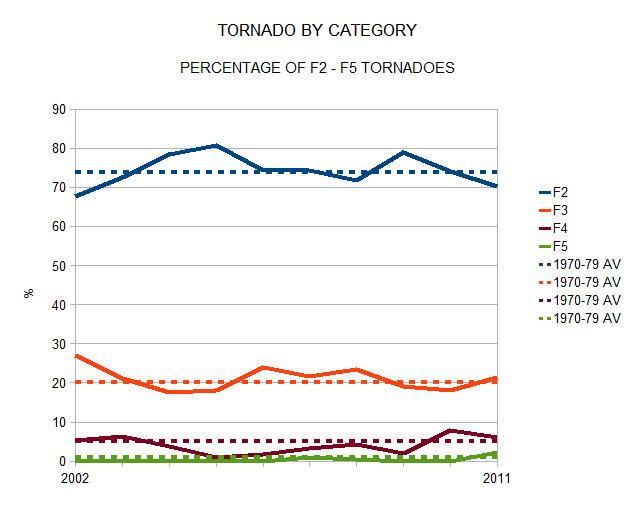
Figure 5
Figure 5 shows the number of F2+ tornadoes by category for each year since 2002 expressed as a percentage of the total of F2 to F5 occurrences. The dotted lines are the averages for the 1970’s. Although 2011 experienced a sharp increase in F3, F4 and F5’s, the pattern over the 10 years as a whole does not seem to indicate any real trend, simply going up and down around the historical averages.
Conclusions
Whilst nobody can predict what 2012 will bring, there fortunately seems to be no evidence to suggest that there is any trend towards an increase in numbers or severity of tornadoes in the US.
Notes
1) The F-scale (Fujita) was uprated to the EF-scale (Enhanced Fujita) in 2007. The intent at the time was that the new scale should be consistent with the old one, and that, therefore, previous years would not be “revalued”. (More on the change here.) Please excuse me then, when I use both terminologies at different times!
2) All tornado statistics have been sourced from the Storm Prediction Centre.
See also Mark Johnson’s coverage of the CNN ridiculous tornado climate change relationship claim by former brainwashed by TWC weathercaster. CNN had a much more knowledgeable staff before ratings dropped and they had to go bottom fishing.
And as for republicans vs democrats, I know as many democrat scientists who are skeptic as republicans. And many liberals have abandoned the AGW movement when they looked into the data. It is a goal of the media and the democrats to portray the issue as left “settled science” versus right “denialist science”. It is really right versus wrong, good science versus bad politically driven science. And the democrats have helped fund the scientists and create this bad science and left leaning media has promoted the bad science and ignored all evidence to the contrary. Unfortunately our friend Paul has never really looked at other factors and has been hugely succesful in entreprenual businesses mainly built around the use of mesoscale high resolution computer models and computer driven visualizations. Whether he admits it or not (and he claims he has been burned by computer models as have all broadcasters) there is a certain trust factor built in. Joe Bastardi and I could show him how the natural factors are the real drivers using real data not models. JB tried to submit this comment to the blogs. It was a letter to Paul with links.
In his Farewell address to the nation Dwight Eisenhower in the speech remembered for comments on the military industrial complex also had a lot to say about poitically driven science:
Partly because of the huge costs involved, a government contract becomes virtually a substitute for intellectual curiosity. For every old blackboard there are now hundreds of new electronic computers. The prospect of domination of the nation’s scholars by federal employment, project allocations, and the power of money is ever present - and is gravely to be regarded. Yet in holding scientific research and discovery in respect, as we should, we must also be alert to the equal and opposite danger that public policy could itself become the captive of a scientific-technological elite.